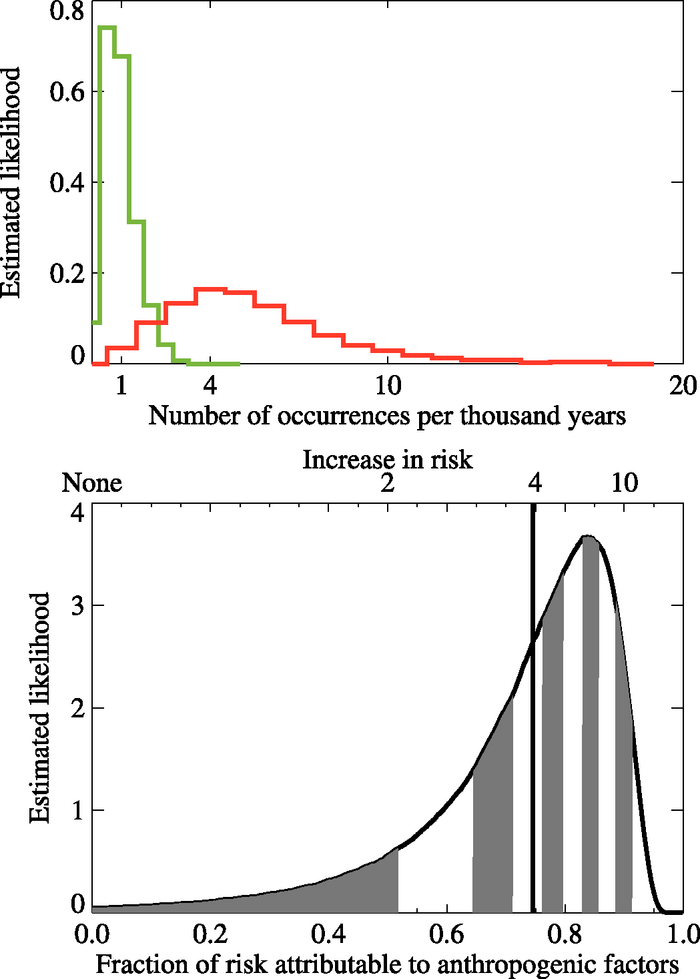
Figure 9.13. Change in risk of mean European summer temperatures exceeding a threshold of 1.6°C above 1961 to 1990 mean temperatures, a threshold that was exceeded in 2003 but in no other year since the start of the instrumental record in 1851. (Top) Frequency histograms of the estimated likelihood of the risk (probability) of exceeding a 1.6°C threshold (relative to the 1961–1990 mean) in the 1990s in the presence (red curve) and absence (green curve) of anthropogenic change, expressed as an occurrence rate. (Bottom) Fraction of attributable risk (FAR). The vertical line indicates the ‘best estimate’ FAR, the mean risk attributable to anthropogenic factors averaged over the distribution. The alternation between grey and white bands indicates the deciles of the estimated FAR distribution. The shift from the green to the red distribution in (a) implies a FAR distribution with mean 0.75, corresponding to a four-fold increase in the risk of such an event (b). From Stott et al. (2004).