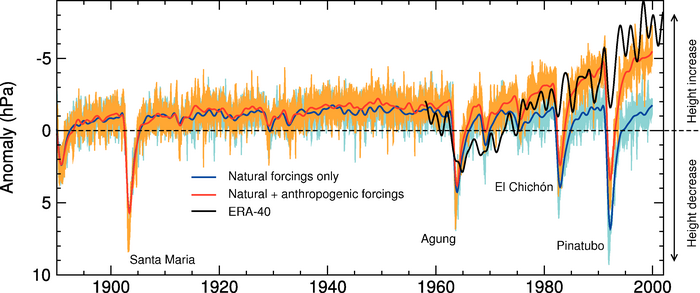
Figure 9.14. Comparison between reanalysis and climate-model simulated global monthly mean anomalies in tropopause height. Model results are from two different PCM ( Table 8.1 ) ensemble experiments using either natural forcings, or natural and anthropogenic forcings (ALL). There are four realisations of each experiment. Both the low-pass filtered ensemble mean and the unfiltered range between the highest and lowest values of the realisations are shown. All model anomalies are defined relative to climatological monthly means computed over 1890 to 1999. Reanalysis-based tropopause height anomalies estimated from ERA-40 were filtered in the same way as model data. The ERA-40 record spans 1957 to 2002 and was forced to have the same mean as ALL over 1960 to 1999. After Santer et al. (2003a) and Santer et al. (2004).