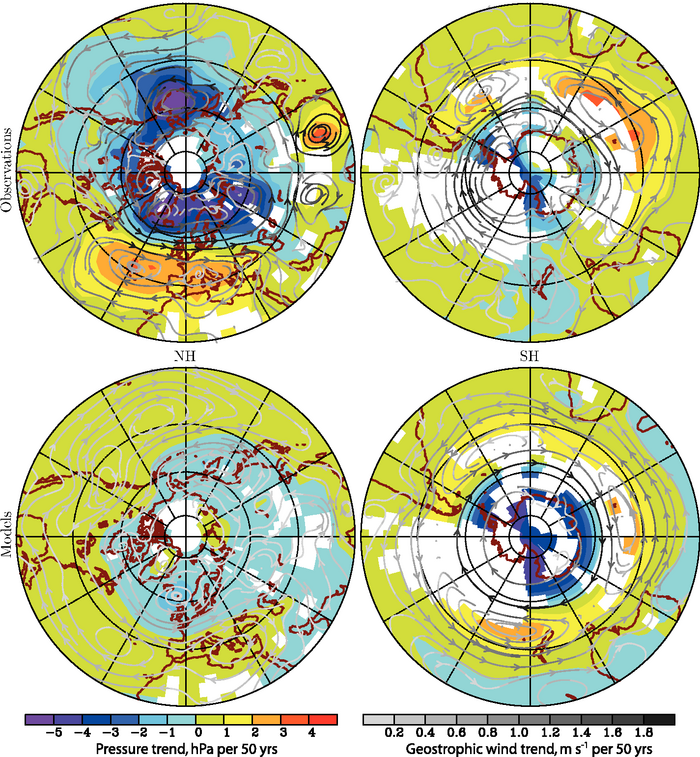
Figure 9.16. Comparison between observed (top) and model-simulated (bottom) December to February sea-level pressure trends (hPa per 50 years) in the NH (left panels) and SH (right panels) based on decadal means for the period 1955 to 2005. Observed trends are based on the Hadley Centre Mean Sea Level Pressure data set (HadSLP2r, an infilled observational data set; Allan and Ansell, 2006). Model-simulated trends are the mean simulated response to greenhouse gas, sulphate aerosol, stratospheric ozone, volcanic aerosol and solar irradiance changes from eight coupled models (CCSM3, GFDL-CM2.0, GFDL-CM2.1, GISS-EH, GISS-ER, MIROC3.2(medres), PCM, UKMO-HadCM3; see Table 8.1 for model descriptions). Streamlines indicate the direction of the trends (m s–1 per 50 years) in the geostrophic wind velocity derived from the trends in sea level pressure, and the shading of the streamlines indicates the magnitude of the change, with darker streamlines corresponding to larger changes in geostrophic wind. White areas in all panels indicate regions with insufficient station-based measurements to constrain analysis. Further explanation of the construction of this figure is provided in the Supplementary Material, Appendix 9.C . Updated after Gillett et al. (2005).