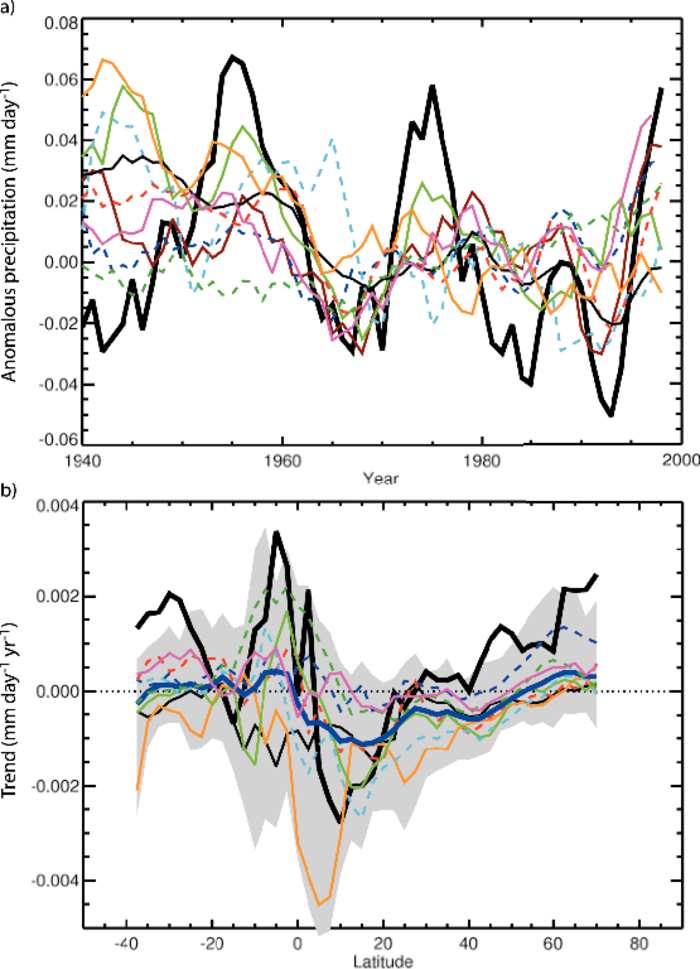
Figure 9.18. Simulated and observed anomalies (with respect to 1961-1990) in terrestrial mean precipitation (a), and zonal mean precipitation trends 1901-1998 (b). Observations (thick black line) are based on a gridded data set of terrestrial rain gauge measurements (Hulme et al., 1998). Model data are from 20th-century MMD integrations with anthropogenic, solar and volcanic forcing from the following coupled climate models (see Table 8.1 for model details): UKMO-HadCM3 (brown), CCSM3 (dark blue), GFDL-CM2.0 (pale green), GFDL-CM2.1 (pale blue), GISS-EH (red), GISS-ER (thin black), MIROC3.2(medres) (orange), MRI-CGCM2.3.2 (dark green) and PCM (pink). Coloured curves are ensemble means from individual models. In (a), a five-year running mean was applied to suppress other sources of natural variability, such as ENSO. In (b), the grey band indicates the range of trends simulated by individual ensemble members, and the thick dark blue line indicates the multi-model ensemble mean. External influence in observations on global terrestrial mean precipitation is detected with those precipitation simulations shown by continuous lines in the top panel. Adapted from Lambert et al. (2005).