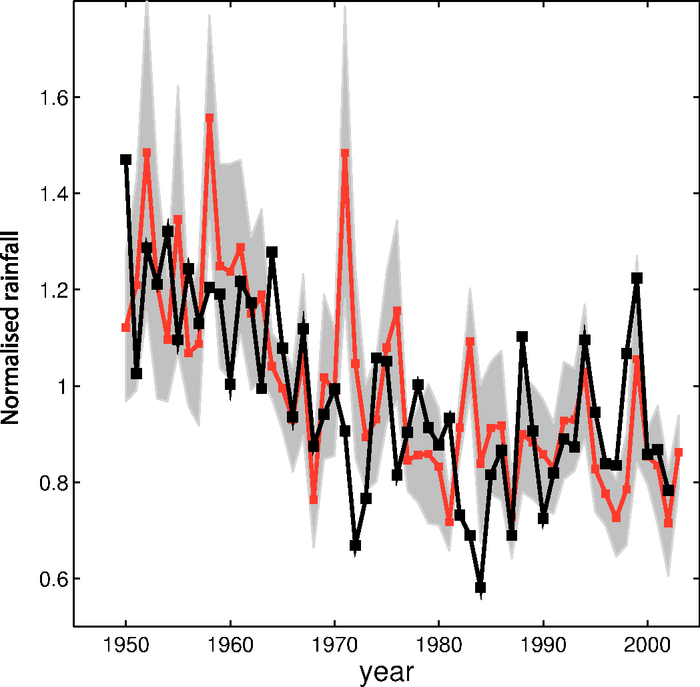
Figure 9.19. Observed (Climatic Research Unit TS 2.1; Mitchell and Jones, 2005) Sahel July to September rainfall for each year (black), compared to an ensemble mean of 10 simulations of the atmospheric/land component of the GFDL-CM2.0 model (see Table 8.1 for model details) forced with observed SSTs (red). Both model and observations are normalized to unit mean over 1950-2000. The grey band represents ±1 standard deviation of intra-ensemble variability. After Held et al. (2005), based on results in Lu and Delworth (2005).