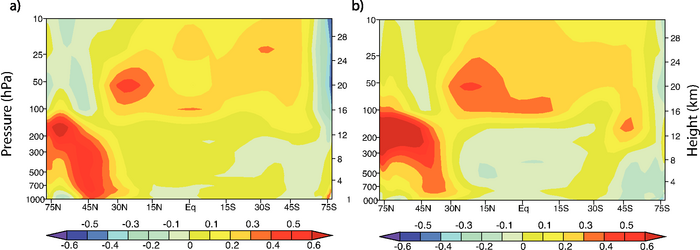
Figure 9.2. The zonal mean equilibrium temperature change (°C) between a present day minus a pre-industrial simulation by the CSIRO atmospheric model coupled to a mixed-layer ocean model from (a) direct forcing from fossil fuel black carbon and organic matter (BC+OM) and (b) the sum of fossil fuel BC+OM and biomass burning. Plot is from 1,000 hPa to 10 hPa (shown on left scale) and from 0 km to 30 km (shown on right). Note the difference in colour scale from Figure 9.1. See Supplementary Material, Appendix 9.C for additional information. Based on Penner et al. (2007).