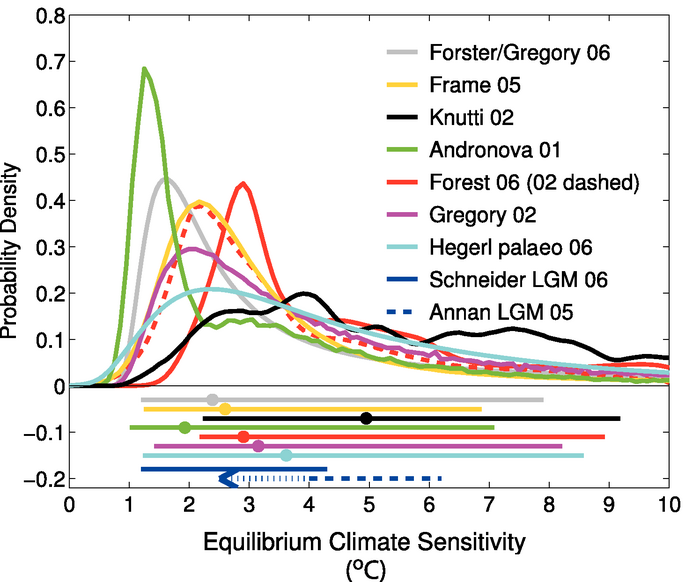
Figure 9.20. Comparison between different estimates of the PDF (or relative likelihood) for ECS (°C). All PDFs/likelihoods have been scaled to integrate to unity between 0°C and 10°C ECS. The bars show the respective 5 to 95% ranges, dots the median estimate. The PDFs/likelihoods based on instrumental data are from Andronova and Schlesinger (2001), Forest et al. (2002; dashed line, considering anthropogenic forcings only), Forest et al. (2006; solid, anthropogenic and natural forcings), Gregory et al. (2002a), Knutti et al. (2002), Frame et al. (2005), and Forster and Gregory (2006), transformed to a uniform prior distribution in ECS using the method after Frame et al. (2005). Hegerl et al. (2006a) is based on multiple palaeoclimatic reconstructions of NH mean temperatures over the last 700 years. Also shown are the 5 to 95% approximate ranges for two estimates from the LGM (dashed, Annan et al., 2005; solid, Schneider von Deimling et al., 2006) which are based on models with different structural properties. Note that ranges extending beyond the published range in Annan et al. (2005), and beyond that sampled by the climate model used there, are indicated by dots and an arrow, since Annan et al. only provide an upper limit. For details of the likelihood estimates, see Table 9.3 . After Hegerl et al. (2006a).