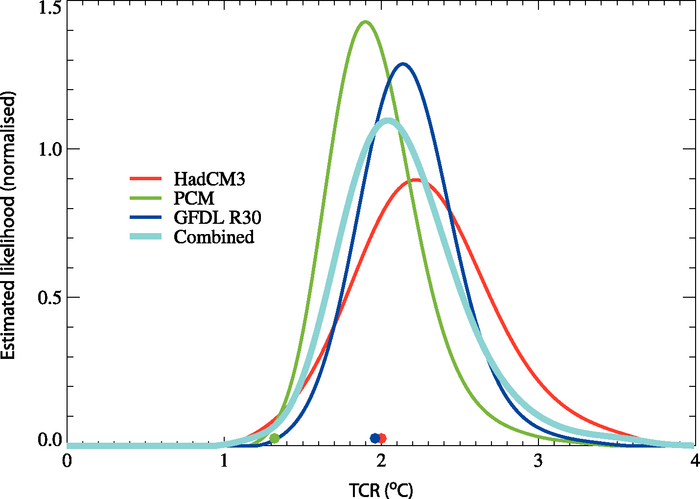
Figure 9.21. Probability distributions of TCR (expressed as warming at the time of CO2 doubling), as constrained by observed 20th-century temperature change, for the HadCM3 ( Table 8.1 , red), PCM ( Table 8.1 , green) and GFDL R30 (Delworth et al., 2002, blue) models. The average of the PDFs derived from each model is shown in turquoise. Coloured circles show each model’s TCR. (After Stott et al., 2006c).