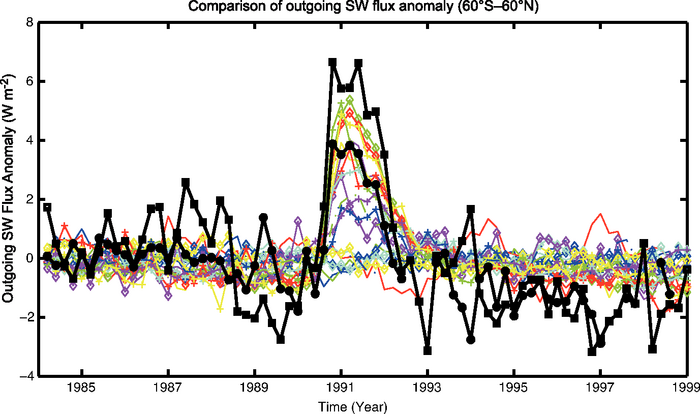
Figure 9.3. Comparison of outgoing shortwave radiation flux anomalies (in W m–2, calculated relative to the entire time period) from several models in the MMD archive at PCMDI (coloured curves) with ERBS satellite data (black with stars; Wong et al., 2006) and with the ISCCP flux data set (black with squares; Zhang et al., 2004). Models shown are CCSM3, CGCM3.1(T47), CGCM3.1(T63), CNRM-CM3, CSIRO-MK3.0, FGOALS-g1.0, GFDL-CM2.0, GFDL-CM2.1, GISS-AOM, GISS-EH, GISS-ER, INM-CM3.0, IPSL-CM4, and MRI-CGCM2.3.2 (see Table 8.1 for model details). The comparison is restricted to 60°S to 60°N because the ERBS data are considered more accurate in this region. Note that not all models included the volcanic forcing from Mt. Pinatubo (1991–1993) and so do not predict the observed increase in outgoing solar radiation. See Supplementary Material, Appendix 9.C for additional information.