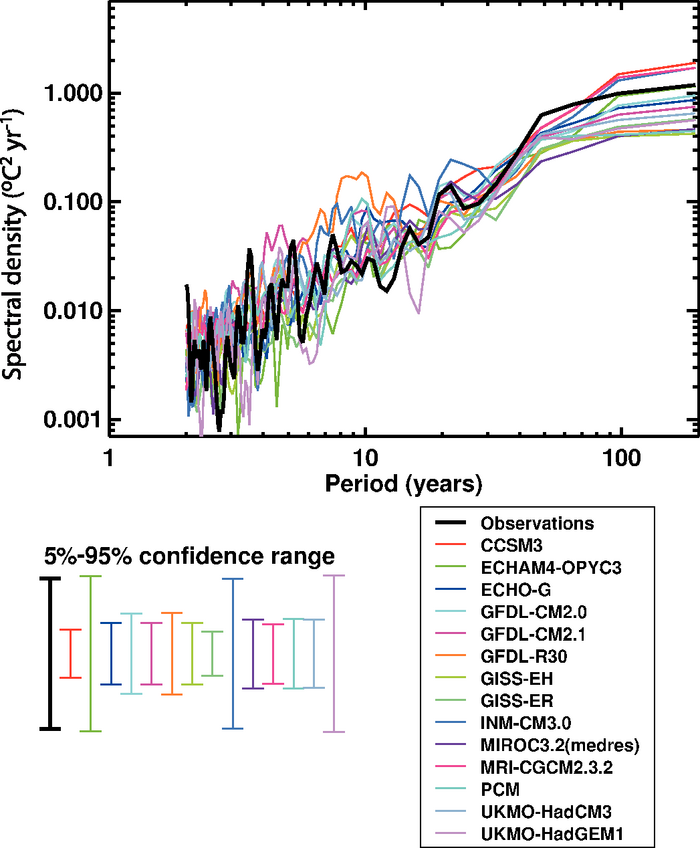
Figure 9.7. Comparison of variability as a function of time scale of annual global mean temperatures (°C2 yr–1) from the observed record (Hadley Centre/Climatic Research Unit gridded surface temperature data set (HadCRUT3), Brohan et al., 2006) and from AOGCM simulations including both anthropogenic and natural forcings. All power spectra are estimated using a Tukey-Hanning filter of width 97 years. The model spectra displayed are the averages of the individual spectra estimated from individual ensemble members. The same 58 simulations and 14 models are used as in Figure 9.5a. All models simulate variability on decadal time scales and longer that is consistent with observations at the 10% significance level. Further details of the method of calculating the spectra are given in the Supplementary Material, Appendix 9.C .