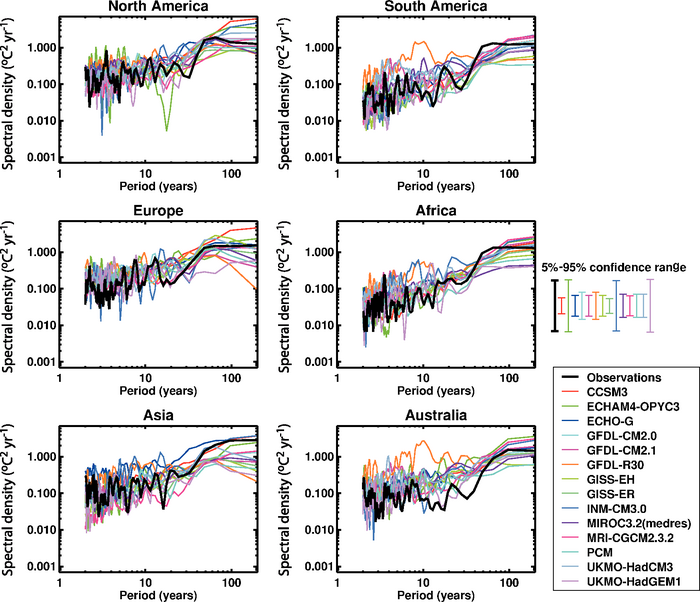
Figure 9.8. As Figure 9.7, except for continental mean temperature. Spectra are calculated in the same manner as Figure 9.7. See the Supplementary Material, Appendix 9.C for a description of the regions and for details of the method used. Models simulate variability on decadal time scales and longer that is consistent with observations in all cases except two models over South America, five models over Asia and two models over Australia (at the 10% significance level).