Working Group 3 - Chapter 10: Waste management - (AR4-WG3-10)
Original at: http://www.ipcc.ch/publications_and_data/ar4/wg3/en/ch10.html
Main AR4 Index | Working Group WG3 Index | Table of Contents | Authors | Executive Summary | Annotated Text | References | Reviewer Comments
With the exception of Chapter and Section headings, all coloured text has been inserted by AccessIPCC. The non-coloured text is the IPCC original.
A number of emails from the Climate Research Unit (CRU) of the University of East Anglia were published on the Internet in November 2009. This has provided a window into the world of climate science.
We have identified a number of key individuals involved in the emails whom we have designated as Persons of Concern [PoC]; a Journal in which a PoC has published has been designated as a Journal of Concern [JoC].
This is not to suggest that we believe such papers are necessarily flawed, but rather that, as Joseph Alcamo noted at Bali in October 2009, "as policymakers and the public begin to grasp the multi-billion dollar price tag for mitigating and adapting to climate change, we should expect a sharper questioning of the science behind climate policy".
References occur in a list at the end of each chapter. Citations are within the normal text of sections and paragraphs.
| Tag | Explanation | Where Used | References | Citations |
|---|---|---|---|---|
| PoC |
Person of Concern Key individual involved in CRU emails as defined in this spreadsheet. |
References, Citations, IPCC Roles | 1 | 1 |
| JoC |
Journal of Concern A Journal which has published articles by one or more PoCs (Person of Concern) |
References, Citations | 7 | 18 |
| MoS |
Model or Simulation Reference appears to be a model or simulation, not observation or experiment |
References, Citations | 17 | 34 |
| NPR |
Non Peer Reviewed Reference has no Journal or no Volume or no Pages or it has Editors. |
References, Citations | 108 | 165 |
| SRC |
Self Reference Concern Author of a chapter containing references to own work. |
References, Citations, IPCC Roles | 29 | 68 |
| ARC |
Paper authored or co-authored by person who is also in list of Authors of another chapter. |
References, Citations | 5 | 14 |
| 2007 |
Paper dated 2007, when IPCC policy stated cutoff was December 2005 |
References, Citations | 3 | 3 |
| Ambiguous |
The short inline citation matched with more than one reference; however, AccessIPCC will link to the first reference found. |
Citations | - | 3 |
| NotFound |
The short inline citation was not matched with any reference. Believed to be caused by typing errors. |
Citations | - | 8 |
| Clean |
The reference was probably peer reviewed. |
References, Citations | 51 | 60 |
Coordinating Lead Authors:
Jean Bogner (USA) [SRC:11],
| Concern | Occurrence |
|---|---|
| SRC >= 5 | 1 |
| Potentially Biased Authors | 1 |
Lead Authors:
Mohammed Abdelrafie Ahmed (Sudan), Cristobal Diaz (Cuba), Andre Faaij (The Netherlands) [SRC:2], Qingxian Gao (China) [SRC:2], Seiji Hashimoto (Japan) [SRC:1], Katarina Mareckova (Slovakia), Riitta Pipatti (Finland) [SRC:4], Tianzhu Zhang (China),
| Concern | Occurrence |
|---|---|
| SRC 1-4 | 4 |
| Potentially Biased Authors | 4 |
| Impartial Authors | 4 |
Contributing Authors:
Luis Diaz (USA) [SRC:4], Peter Kjeldsen (Denmark) [SRC:7], Suvi Monni (Finland) [SRC:1], Review Editors: Robert Gregory (UK), R.T.M. Sutamihardja (Indonesia),
| Concern | Occurrence |
|---|---|
| SRC >= 5 | 1 |
| SRC 1-4 | 2 |
| Potentially Biased Authors | 3 |
| Impartial Authors | 2 |
This chapter should be cited as:
Bogner, J., M. Abdelrafie Ahmed, C. Diaz, A. Faaij, Q. Gao, S. Hashimoto, K. Mareckova, R. Pipatti, T. Zhang, Waste Management, In Climate Change 2007: Mitigation. Contribution of Working Group III to the Fourth Assessment Report of the Intergovernmental Panel on Climate Change [B. Metz, O.R. Davidson, P.R. Bosch, R. Dave, L.A. Meyer (eds)], Cambridge University Press, Cambridge, United Kingdom and New York, NY, USA.
EXECUTIVE SUMMARY
Post-consumer waste is a small contributor to global greenhouse gas (GHG) emissions (<5%) with total emissions of approximately 1300 MtCO2-eq in 2005 . The largest source is landfill methane (CH4), followed by wastewater CH4 and nitrous oxide (N2O); in addition, minor emissions of carbon dioxide (CO2) result from incineration of waste containing fossil carbon (C) (plastics; synthetic textiles) (high evidence, high agreement). There are large uncertainties with respect to direct emissions, indirect emissions and mitigation potentials for the waste sector. These uncertainties could be reduced by consistent national definitions, coordinated local and international data collection, standardized data analysis and field validation of models (medium evidence, high agreement). With respect to annual emissions of fluorinated gases from post-consumer waste, there are no existing national inventory methods for the waste sector, so these emissions are not currently quantified. If quantified in the future, recent data indicating anaerobic biodegradation of chlorofluorocarbons (CFCs) and hydrochlorofluorocarbons (HCFCs) in landfill settings should be considered (low evidence, high agreement).
Existing waste-management practices can provide effective mitigation of GHG emissions from this sector: a wide range of mature, environmentally-effective technologies are available to mitigate emissions and provide public health, environmental protection, and sustainable development co-benefits. Collectively, these technologies can directly reduce GHG emissions (through landfill gas recovery, improved landfill practices, engineered wastewater management) or avoid significant GHG generation (through controlled composting of organic waste, state-of-the-art incineration and expanded sanitation coverage) (high evidence, high agreement). In addition, waste minimization, recycling and re-use represent an important and increasing potential for indirect reduction of GHG emissions through the conservation of raw materials, improved energy and resource efficiency and fossil fuel avoidance (medium evidence, high agreement).
Because waste management decisions are often made locally without concurrent quantification of GHG mitigation, the importance of the waste sector for reducing global GHG emissions has been underestimated (medium evidence, high agreement). Flexible strategies and financial incentives can expand waste management options to achieve GHG mitigation goals – in the context of integrated waste management, local technology decisions are a function of many competing variables, including waste quantity and characteristics, cost and financing issues, infrastructure requirements including available land area, collection and transport considerations, and regulatory constraints. Life cycle assessment (LCA) can provide decision-support tools (high evidence, high agreement).
Commercial recovery of landfill CH4 as a source of renewable energy has been practised at full scale since 1975 and currently exceeds 105 MtCO2-eq, yr. Because of landfill gas recovery and complementary measures (increased recycling, decreased landfilling, use of alternative waste-management technologies), landfill CH4 emissions from developed countries have been largely stabilized (high evidence, high agreement). However, landfill CH4 emissions from developing countries are increasing as more controlled (anaerobic) landfilling practices are implemented; these emissions could be reduced by both accelerating the introduction of engineered gas recovery and encouraging alternative waste management strategies (medium evidence, medium agreement).
Incineration and industrial co-combustion for waste-to-energy provide significant renewable energy benefits and fossil fuel offsets. Currently, >130 million tonnes of waste per year are incinerated at over 600 plants (high evidence, high agreement). Thermal processes with advanced emission controls are proven technology but more costly than controlled landfilling with landfill gas recovery; however, thermal processes may become more viable as energy prices increase. Because landfills produce CH4 for decades, incineration, composting and other strategies that reduce landfilled waste are complementary mitigation measures to landfill gas recovery in the short- to medium-term (medium evidence, medium agreement).
Aided by Kyoto mechanisms such as the Clean Development Mechanism (CDM) and Joint Implementation (JI), as well as other measures to increase worldwide rates of landfill CH4 recovery, the total global economic mitigation potential for reducing landfill CH4 emissions in 2030 is estimated to be > 1000 MtCO2-eq (or 70% of estimated emissions) at costs below 100 US$/tCO2-eq/yr. Most of this potential is achievable at negative to low costs: 20–30% of projected emissions for 2030 can be reduced at negative cost and 30–50% at costs <20 US$/tCO2-eq/yr. At higher costs, more significant emission reductions are achievable, with most of the additional mitigation potential coming from thermal processes for waste-to-energy (medium evidence, medium agreement).
Increased infrastructure for wastewater management in developing countries can provide multiple benefits for GHG mitigation, improved public health, conservation of water resources, and reduction of untreated discharges to surface water, groundwater, soils and coastal zones. There are numerous mature technologies that can be implemented to improve wastewater collection, transport, re-use, recycling, treatment and residuals management (high evidence, high agreement). With respect to both waste and wastewater management for developing countries, key constraints on sustainable development include the local availability of capital as well as the selection of appropriate and truly sustainable technology in a particular setting (high evidence, high agreement).
10.1 Introduction
Waste generation is closely linked to population, urbanization and affluence. The archaeologist E.W. Haury wrote: ‘Whichever way one views the mounds [of waste], as garbage piles to avoid, or as symbols of a way of life, they…are the features more productive of information than any others.’ ( 1976, p.80). Archaeological excavations have yielded thicker cultural layers from periods of prosperity; correspondingly, modern waste-generation rates can be correlated to various indicators of affluence, including gross domestic product (GDP)/cap, energy consumption/cap, , and private final consumption/cap ( Bingemer and Crutzen, 1987 [JoC] ;( Richards, 1989; ) ( Rathje et al., 1992; ) Mertins et al., 1999 [NPR] ; US EPA, 1999 [NPR] ; Nakicenovic et al., 2000 [NPR, ARC] ; Bogner and Matthews, 2003 [JoC, MoS, SRC] ; OECD, 2004 [NPR] ). In developed countries seeking to reduce waste generation, a current goal is to decouple waste generation from economic driving forces such as GDP ( OECD, 2003 [NPR] ; Giegrich and Vogt, 2005 [NPR] ; EEA, 2005 [NPR] ). In most developed and developing countries with increasing population, prosperity and urbanization, it remains a major challenge for municipalities to collect, recycle, treat and dispose of increasing quantities of solid waste and wastewater. A cornerstone of sustainable development is the establishment of affordable, effective and truly sustainable waste management practices in developing countries. It must be further emphasized that multiple public health, safety and environmental co-benefits accrue from effective waste management practices which concurrently reduce GHG emissions and improve the quality of life, promote public health, prevent water and soil contamination, conserve natural resources and provide renewable energy benefits.
The major GHG emissions from the waste sector are landfill CH4 and, secondarily, wastewater CH4 and N2O. In addition, the incineration of fossil carbon results in minor emissions of CO2. Chapter 10 focuses on mitigation of GHG emissions from post-consumer waste, as well as emissions from municipal wastewater and high biochemical oxygen demand (BOD) industrial wastewaters conveyed to public treatment facilities. Other chapters in this volume address pre-consumer GHG emissions from waste within the industrial ( Chapter 7 ) and energy ( Chapter 4 ) sectors which are managed within those respective sectors. Other chapters address agricultural wastes and manures ( Chapter 8 ), forestry residues ( Chapter 9 ) and related energy supply issues including district heating ( Chapter 6 ) and transportation biofuels ( Chapter 5 ). National data are not available to quantify GHG emissions associated with waste transport, including reductions that might be achieved through lower collection frequencies, higher routing efficiencies or substitution of renewable fuels; however, all of these measures can be locally beneficial to reduce emissions.
It should be noted that a separate chapter on post-consumer waste is new for the Fourth Assessment report; in the Third Assessment Report (TAR), GHG mitigation strategies for waste were discussed primarily within the industrial sector ( (Ackerman, 2000; ) IPCC, 2001a [NPR] ). It must also be stressed that there are high uncertainties regarding global GHG emissions from waste which result from national and regional differences in definitions, data collection and statistical analysis. Because of space constraints, this chapter does not include detailed discussion of waste management technologies, nor does this chapter prescribe to any one particular technology. Rather, this chapter focuses on the GHG mitigation aspects of the following strategies: landfill CH4 recovery and utilization; optimizing methanotrophic CH4 oxidation in landfill cover soils; alternative strategies to landfilling for GHG avoidance (composting; incineration and other thermal processes; mechanical and biological treatment (MBT)); waste reduction through recycling, and expanded wastewater management to minimize GHG generation and emissions. In addition, using available but very limited data, this chapter will discuss emissions of non-methane volatile organic compounds (NMVOCs) from waste and end-of-life issues associated with fluorinated gases.
The mitigation of GHG emissions from waste must be addressed in the context of integrated waste management. Most technologies for waste management are mature and have been successfully implemented for decades in many countries. Nevertheless, there is significant potential for accelerating both the direct reduction of GHG emissions from waste as well as extended implications for indirect reductions within other sectors. LCA is an essential tool for consideration of both the direct and indirect impacts of waste management technologies and policies ( (Thorneloe et al., 2002; ) 2005; WRAP, 2006 [NPR] ). Because direct emissions represent only a portion of the life cycle impacts of various waste management strategies ( (Ackerman, 2000 ) ), this chapter includes complementary strategies for GHG avoidance, indirect GHG mitigation and use of waste as a source of renewable energy to provide fossil fuel offsets. Using LCA and other decision-support tools, there are many combined mitigation strategies that can be cost-effectively implemented by the public or private sector. Landfill CH4 recovery and optimized wastewater treatment can directly reduce GHG emissions. GHG generation can be largely avoided through controlled aerobic composting and thermal processes such as incineration for waste-to-energy. Moreover, waste prevention, minimization, material recovery, recycling and re-use represent a growing potential for indirect reduction of GHG emissions through decreased waste generation, lower raw material consumption, reduced energy demand and fossil fuel avoidance. Recent studies (e.g., Smith et al., 2001 [NPR] ; WRAP, 2006 [NPR] ) have begun to comprehensively quantify the significant benefits of recycling for indirect reductions of GHG emissions from the waste sector.
Post-consumer waste is a significant renewable energy resource whose energy value can be exploited through thermal processes (incineration and industrial co-combustion), landfill gas utilization and the use of anaerobic digester biogas. Waste has an economic advantage in comparison to many biomass resources because it is regularly collected at public expense (See also Section 11.3.1.4 ). The energy content of waste can be more efficiently exploited using thermal processes than with the production of biogas: during combustion, energy is directly derived both from biomass (paper products, wood, natural textiles, food) and fossil carbon sources (plastics, synthetic textiles). The heating value of mixed municipal waste ranges from <6 to >14 MJ/kg ( Khan and Abu-Ghararath, 1991 [MoS] ; EIPPC Bureau, 2006 ). Thermal processes are most effective at the upper end of this range where high values approach low-grade coals (lignite). Using a conservative value of 900 Mt/yr for total waste generation in 2002 (discussed in Box 10.1 below), the energy potential of waste is approximately 5–13 EJ/yr. Assuming an average heating value of 9 GJ/t for mixed waste (Dornburg and Faaij, 2006 [SRC] ) and converting to energy equivalents, global waste in 2002 contained about 8 EJ of available energy, which could increase to 13 EJ in 2030 using waste projections in Monni et al. 2006 [NPR, SRC] ). Currently, more than 130 million tonnes per year of waste are combusted worldwide ( (Themelis, 2003 ) ), which is equivalent to >1 EJ/yr (assuming 9 GJ/t). The biogas fuels from waste – landfill gas and digester gas – typically have a heating value of 16–22 MJ/Nm3, depending directly on the CH4 content. Both are used extensively worldwide for process heating and on-site electrical generation; more rarely, landfill gas may be upgraded to a substitute natural gas product. Conservatively, the energy value of landfill gas currently being utilized is >0.2 EJ/yr (using data from Willumsen, 2003 [NPR] ).
An overview of carbon flows through waste management systems addresses the issue of carbon storage versus carbon turnover for major waste-management strategies including landfilling, incineration and composting ( Figure 10.1 ). Because landfills function as relatively inefficient anaerobic digesters, significant long-term carbon storage occurs in landfills, which is addressed in the 2006 IPCC Guidelines for National Greenhouse Gas Inventories ( IPCC, 2006 [NPR] ). Landfill CH4 is the major gaseous C emission from waste; there are also minor emissions of CO2 from incinerated fossil carbon (plastics). The CO2 emissions from biomass sources – including the CO2 in landfill gas, the CO2 from composting, and CO2 from incineration of waste biomass – are not taken into account in GHG inventories as these are covered by changes in biomass stocks in the land-use, land-use change and forestry sectors.
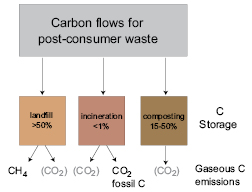
Figure 10.1: Carbon flows through major waste management systems including C storage and gaseous C emissions. The CO2 from biomass is not included in GHG inventories for waste.
References for C storage are: Huber-Humer, 2004 [NPR] ;( Zinati et al., 2001; ) Barlaz, 1998 [JoC] ; Bramryd, 1997 [NPR] ; Bogner, 1992 [SRC] .
A process-oriented perspective on the major GHG emissions from the waste sector is provided in Figure 10.2 . In the context of a landfill CH4 mass balance ( Figure 10.2 a), emissions are one of several possible pathways for the CH4 produced by anaerobic methanogenic microorganisms in landfills; other pathways include recovery, oxidation by aerobic methanotrophic microorganisms in cover soils, and two longer-term pathways: lateral migration and internal storage ( Bogner and Spokas, 1993 [SRC] ; Spokas et al., 2006 [SRC] ). With regard to emissions from wastewater transport and treatment ( Figure 10.2 b), the CH4 is microbially produced under strict anaerobic conditions as in landfills, while the N2O is an intermediate product of microbial nitrogen cycling promoted by conditions of reduced aeration, high moisture and abundant nitrogen. Both GHGs can be produced and emitted at many stages between wastewater sources and final disposal.
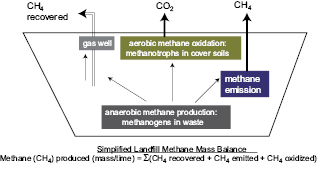
Figure 10.2: Pathways for GHG emissions from landfills and wastewater systems:
Figure 10.2a: Simplified landfill CH4 mass balance: pathways for CH4 generated in landfilled waste, including CH4 emitted, recovered and oxidized.
Note: Not shown are two longer-term CH4 pathways: lateral CH4 mitigation and internal changes in CH4 storage ( Bogner and Spokas, 1993 [SRC] ; Spokas et al., 2006 [SRC] ) Methane can be stored in shallow sediments for several thousand years ( Coleman, 1979 [NPR] ).
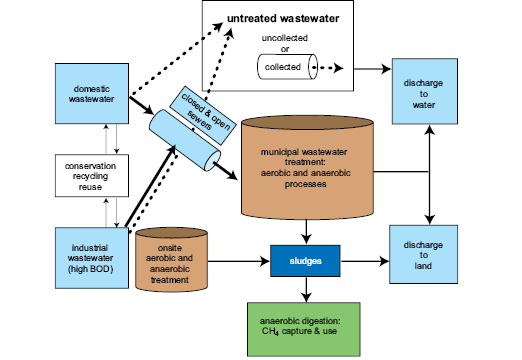
Figure 10.2b: Overview of wastewater systems.
Note: The major GHG emissions from wastewater – CH4 and N2O – can be emitted during all stages from sources to disposal, but especially when collection and treatment are lacking. N2O results from microbial N cycling under reduced aeration; CH4 results from anaerobic microbial decomposition of organic C substrates in soils, surface waters or coastal zones.
It is important to stress that both the CH4 and N2O from the waste sector are microbially produced and consumed with rates controlled by temperature, moisture, pH, available substrates, microbial competition and many other factors. As a result, CH4 and N2O generation, microbial consumption, and net emission rates routinely exhibit temporal and spatial variability over many orders of magnitude, exacerbating the problem of developing credible national estimates. The N2O from landfills is considered an insignificant source globally (Bogner et al., 1999 [NotFound] ;( Rinne et al., 2005 ) ), but may need to be considered locally where cover soils are amended with sewage sludge ( (Borjesson and Svensson, 1997a ) ) or aerobic/semi-aerobic landfilling practices are implemented ( (Tsujimoto et al., 1994 ) ). Substantial emissions of CH4 and N2O can occur during wastewater transport in closed sewers and in conjunction with anaerobic or aerobic treatment. In many developing countries, in addition to GHG emissions, open sewers and uncontrolled solid waste disposal sites result in serious public health problems resulting from pathogenic microorganisms, toxic odours and disease vectors.
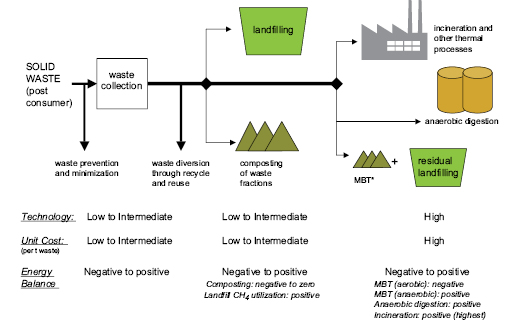
Major issues surrounding the costs and potentials for mitigating GHG emissions from waste include definition of system boundaries and selection of models with correct baseline assumptions and regionalized costs, as discussed in the TAR ( IPCC, 2001a [NPR] ). Quantifying mitigation costs and potentials ( Section 10.4.7 ) for the waste sector remains a challenge due to national and regional data uncertainties as well as the variety of mature technologies whose diffusion is limited by local costs, policies, regulations, available land area, public perceptions and other social development factors. Discussion of technologies and mitigation strategies in this chapter ( Section 10.4 ) includes a range of approaches from low-technology/low-cost to high-technology/high-cost measures. Often there is no single best option; rather, there are multiple measures available to decision-makers at the municipal level where several technologies may be collectively implemented to reduce GHG emissions and achieve public health, environmental protection and sustainable development objectives.
10.2 Status of the waste management sector
10.2.1 Waste generation
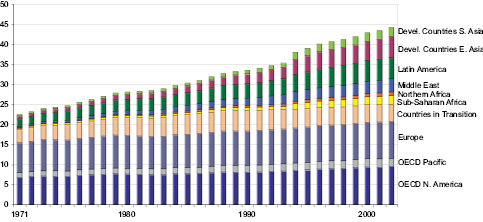
The availability and quality of annual data are major problems for the waste sector. Solid waste and wastewater data are lacking for many countries, data quality is variable, definitions are not uniform, and interannual variability is often not well quantified. There are three major approaches that have been used to estimate global waste generation: 1) data from national waste statistics or surveys, including IPCC methodologies ( IPCC, 2006 [NPR] ); 2) estimates based on population (e.g., SRES waste scenarios), and 3) the use of a proxy variable linked to demographic or economic indicators for which national data are annually collected. The SRES waste scenarios, using population as the major driver, projected continuous increases in waste and wastewater CH4 emissions to 2030 (A1B-AIM), 2050 (B1-AIM), or 2100 (A2-ASF; B2-MESSAGE), resulting in current and future emissions significantly higher than those derived from IPCC inventory procedures ( Nakicenovic et al., 2000 [NPR, ARC] ) (See also Section 10.3 ). A major reason is that waste generation rates are related to affluence as well as population – richer societies are characterized by higher rates of waste generation per capita, while less affluent societies generate less waste and practise informal recycling/re-use initiatives that reduce the waste per capita to be collected at the municipal level. The third strategy is to use proxy or surrogate variables based on statistically significant relationships between waste generation per capita and demographic variables, which encompass both population and affluence, including GDP per capita ( (Richards, 1989; ) Mertins et al., 1999 [NPR] ) and energy consumption per capita ( Bogner and Matthews, 2003 [JoC, MoS, SRC] ). The use of proxy variables, validated using reliable datasets, can provide a cross-check on uncertain national data. Moreover, the use of a surrogate provides a reasonable methodology for a large number of countries where data do not exist, a consistent methodology for both developed and developing countries and a procedure that facilitates annual updates and trend analysis using readily available data ( Bogner and Matthews, 2003 [JoC, MoS, SRC] ). The box below illustrates 1971 – 2002 trends for regional solid-waste generation using the surrogate of energy consumption per capita. Using UNFCCC-reported values for percentage biodegradable organic carbon in waste for each country, this box also shows trends for landfill carbon storage based upon the reported data.
Box 10.1: 1971–2002 Regional trends for solid waste generation and landfill carbon storage using a proxy variable.
Solid-waste generation rates are a function of both population and prosperity, but data are lacking or questionable for many countries. This results in high uncertainties for GHG emissions estimates, especially from developing countries. One strategy is to use a proxy variable for which national statistics are available on an annual basis for all countries. For example, using national solid-waste data from 1975 – 1995 that were reliably referenced to a given base year, Bogner and Matthews 2003 [JoC, MoS, SRC] ) developed simple linear regression models for waste generation per capita for developed and developing countries. These empirical models were based on energy consumption per capita as an indicator of affluence and a proxy for waste generation per capita; the surrogate relationship was applied to annual national data using either total population (developed countries) or urban population (developing countries). The methodology was validated using post- 1995 data which had not been used to develop the original model relationships. The results by region for 1971 – 2002 ( Figure 10.3 a) indicate that approximately 900 Mt of waste were generated in 2002 . Unlike projections based on population alone, this figure also shows regional waste-generation trends that decrease and increase in tandem with major economic trends. For comparison, recent waste-generation estimates by Monni et al. 2006 [NPR, SRC] ) using 2006 inventory guidelines, indicated about 1250 Mt of waste generated in 2000 . Figure 10.3 b showing annual carbon storage in landfills was developed using the same base data as Figure 10.3 a with the percentage of landfilled waste for each country (reported to UNFCCC) and a conservative assumption of 50% carbon storage ( Bogner, 1992 [SRC] ; Barlaz, 1998 [JoC] ). This storage is long-term: under the anaerobic conditions in landfills, lignin does not degrade significantly ( (Chen et al., 2004 ) ), while some cellulosic fractions are also non-degraded. The annual totals for the mid- 1980 s and later (>30 MtC/yr) exceed estimates in the literature for the annual quantity of organic carbon partitioned to long-term geologic storage in marine environments as a precursor to future fossil fuels ( Bogner, 1992 [SRC] ). It should be noted that the anaerobic burial of waste in landfills (with resulting carbon storage) has been widely implemented in developed countries only since the 1960 s and 1970 s.
Solid waste generation rates range from <0.1 t/cap/yr in low-income countries to >0.8 t/cap/yr in high-income industrialized countries ( Table 10.1 ). Even though labour costs are lower in developing countries, waste management can constitute a larger percentage of municipal income because of higher equipment and fuel costs ( (Cointreau-Levine, 1994 ) ). By 1990, many developed countries had initiated comprehensive recycling programmes. It is important to recognize that the percentages of waste recycled, composted, incinerated or landfilled differ greatly amongst municipalities due to multiple factors, including local economics, national policies, regulatory restrictions, public perceptions and infrastructure requirements.
Table 10.1: Municipal solid waste-generation rates and relative income levels
| Country | Low income | Middle income | High income |
|---|---|---|---|
|
Annual income (US$/cap/yr) |
825-3255 | 3256-10065 | >10066 |
|
Municipal solid waste generation rate (t/cap/yr) |
0.1-0.6 | 0.2-0.5 | 0.3 to >0.8 |
10.2.2 Wastewater generation
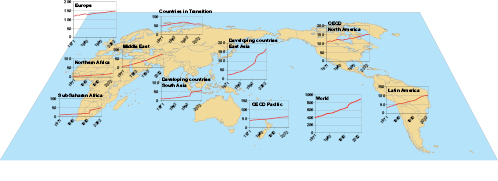
Most countries do not compile annual statistics on the total volume of municipal wastewater generated, transported and treated. In general, about 60% of the global population has sanitation coverage (sewerage) with very high levels (>90%) characteristic for the population of North America (including Mexico), Europe and Oceania, although in the last two regions rural areas decrease to approximately 75% and 80%, respectively ( DESA, 2005 [NPR, MoS] ; Jouravlev, 2004 [NPR] ; PNUD, 2005 [NPR] ; WHO/UNICEF/
WSSCC, 2000 [NPR] , WHO-UNICEF, 2005 [NPR] ; World Bank, 2005a [NPR] ). In developing countries, rates of sewerage are very low for rural areas of Africa, Latin America and Asia, where septic tanks and latrines predominate. For ‘improved sanitation’ (including sewerage + wastewater treatment, septic tanks and latrines), almost 90% of the population in developed countries, but only about 30% of the population in developing countries, has access to improved sanitation ( Jouravlev, 2004 [NPR] ; World Bank, 2005a [NPR] , b). Many countries in Eastern Europe and Central Asia lack reliable benchmarks for the early 1990 s. Regional trends ( Figure 10.4 ) indicate improved sanitation levels of <50% for Eastern and Southern Asia and Sub-Saharan Africa (World Bank and IMF, 2006 [NotFound] ). In Sub-Saharan Africa, at least 450 million people lack adequate sanitation. In both Southern and Eastern Asia, rapid urbanization is posing a challenge for the development of wastewater infrastructure. The highly urbanized region of Latin America and the Caribbean has also made slow progress in providing wastewater treatment. In the Middle East and North Africa, the countries of Egypt, Tunesia and Morocco have made significant progress in expanding wastewater-treatment infrastructure (World Bank and IMF, 2006 [NotFound] ). Nevertheless, globally, it has been estimated that 2.6 billion people lack improved sanitation ( WHO-UNICEF, 2005 [NPR] ).
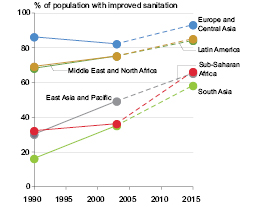
Figure 10.4: Regional data for 1990 and 2003 with 2015 Millenium Development Goal (MDG) targets for the share of population with access to improved sanitation (sewerage + wastewater treatment, septic system, or latrine).
Source: World Bank and IMF 2006 [NotFound] )
Estimates for CH4 and N2O emissions from wastewater treatment require data on degradable organic matter (BOD; COD) and nitrogen. Nitrogen content can be estimated using Food and Agriculture Organization (FAO) data on protein consumption, and either the application of wastewater treatment, or its absence, determines the emissions. Aerobic treatment plants produce negligible or very small emissions, whereas in anaerobic lagoons or latrines 50–80% of the CH4 potential can be produced and emitted. In addition, one must take into account the established infrastructure for wastewater treatment in developed countries and the lack of both infrastructure and financial resources in developing countries where open sewers or informally ponded wastewaters often result in uncontrolled discharges to surface water, soils, and coastal zones, as well as the generation of N2O and CH4. The majority of urban wastewater treatment facilities are publicly operated and only about 14% of the total private investment in water and sewerage in the late 1990 s was applied to the financing of wastewater collection and treatment, mainly to protect drinking water supplies ( Silva, 1998 [NPR] ; World Bank 1997 [NPR] ).
Most wastewaters within the industrial and agricultural sectors are discussed in Chapters 7 and 8 , respectively. However, highly organic industrial wastewaters are addressed in this chapter, because they are frequently conveyed to municipal treatment facilities. Table 10.2 summarizes estimates for total and regional 1990 and 2001 generation in terms of kilograms of BOD per day or kilograms of BOD per worker per day, based on measurements of plant-level water quality (World Bank, 2005a [NPR] ). The table indicates that total global generation decreased >10% between 1990 and 2001; however, increases of 15% or more were observed for the Middle East and the developing countries of South Asia.
Table 10.2: Regional and global 1990 and 2001 generation of high BOD industrial wastewaters often treated by municipal wastewater systems.
| Regions | Kg BOD/day [Total, Rounded] (1000s) | Kg BOD/worker/ day | Primary metals (%) | Paper and pulp (%) | Chemicals (%) | Food and beverages (%) | Textiles (%) | ||
|---|---|---|---|---|---|---|---|---|---|
| Year | 1990 | 2001 | 1990 | 2001 | 2001 | 2001 | 2001 | 2001 | 2001 |
| 1. OECD North America | 3100 | 2600 | 0.20 | 0.17 | 9 | 15 | 11 | 44 | 7 |
| 2. OECD Pacific | 2200 | 1700 | 0.15 | 0.18 | 8 | 20 | 6 | 46 | 7 |
| 3. Europe | 5200 | 4800 | 0.18 | 0.17 | 9 | 22 | 9 | 40 | 7 |
| 4. Countries in transition | 3400 | 2400 | 0.15 | 0.21 | 13 | 8 | 6 | 50 | 14 |
| 5. Sub-Saharan Africa | 590 | 510 | 0.23 | 0.25 | 3 | 12 | 6 | 60 | 13 |
| 6. North Africa | 410 | 390 | 0.20 | 0.18 | 10 | 4 | 6 | 50 | 25 |
| 7. Middle East | 260 | 300 | 0.19 | 0.19 | 9 | 12 | 10 | 52 | 11 |
| 8. Caribbean, Central and South America | 1500 | 1300 | 0.23 | 0.24 | 5 | 11 | 8 | 61 | 11 |
| 9. Developing countries, East Asia | 8300 | 7700 | 0.14 | 0.16 | 11 | 14 | 10 | 36 | 15 |
| 10. Developing countries, South Asia | 1700 | 2000 | 0.18 | 0.16 | 5 | 7 | 6 | 42 | 35 |
| Total for 1-4 (developed) | 13900 | 11500 | |||||||
| Total for 5-10 (developing) | 12800 | 12200 | |||||||
10.2.3 Development trends for waste and wastewater
Waste and wastewater management are highly regulated within the municipal infrastructure under a wide range of existing regulatory goals to protect human health and the environment; promote waste minimization and recycling; restrict certain types of waste management activities; and reduce impacts to residents, surface water, groundwater and soils. Thus, activities related to waste and wastewater management are, and will continue to be, controlled by national regulations, regional restrictions, and local planning guidelines that address waste and wastewater transport, recycling, treatment, disposal, utilization, and energy use. For developing countries, a wide range of waste management legislation and policies have been implemented with evolving structure and enforcement; it is expected that regulatory frameworks in developing countries will become more stringent in parallel with development trends.
Depending on regulations, policies, economic priorities and practical local limits, developed countries will be characterized by increasingly higher rates of waste recycling and pre-treatment to conserve resources and avoid GHG generation. Recent studies have documented recycling levels of >50% for specific waste fractions in some developed countries (i.e., Swedish Environmental Protection Agency, 2005 ). Recent US data indicate about 25% diversion, including more than 20 states that prohibit landfilling of garden waste ( (Simmons et al., 2006 ) ). In developing countries, a high level of labour-intensive informal recycling often occurs. Via various diversion and small-scale recycling activities, those who make their living from decentralized waste management can significantly reduce the mass of waste that requires more centralized solutions; however, the challenge for the future is to provide safer, healthier working conditions than currently experienced by scavengers on uncontrolled dumpsites. Available studies indicate that recycling activities by this sector can generate significant employment, especially for women, through creative microfinance and other small-scale investments. For example, in Cairo, available studies indicate that 7–8 daily jobs per ton of waste and recycling of >50% of collected waste can be attained ( Iskandar, 2001 [NPR] ).
Trends for sanitary landfilling and alternative waste-management technologies differ amongst countries. In the EU, the future landfilling of organic waste is being phased out via the landfill directive (Council Directive 1999 /31/EC), while engineered gas recovery is required at existing sites ( EU, 1999 [NPR] ). This directive requires that, by 2016, the mass of biodegradable organic waste annually landfilled must be reduced 65% relative to landfilled waste in 1995 . Several countries (Germany, Austria, Denmark, Netherlands, Sweden) have accelerated the EU schedule through more stringent bans on landfilling of organic waste. As a result, increasing quantities of post-consumer waste are now being diverted to incineration, as well as to MBT before landfilling to 1) recover recyclables and 2) reduce the organic carbon content by a partial aerobic composting or anaerobic digestion ( Stegmann, 2005 [NPR] ). The MBT residuals are often, but not always, landfilled after achieving organic carbon reductions to comply with the EU landfill directive. Depending on the types and quality control of various separation and treatment processes, a variety of useful recycled streams are also produced. Incineration for waste-to-energy has been widely implemented in many European countries for decades. In 2002, EU WTE plants generated 41 million GJ of electrical energy and 110 million GJ of thermal energy ( (Themelis, 2003 ) ). Rates of incineration are expected to increase in parallel with implemention of the landfill directive, especially in countries such as the UK with historically lower rates of incineration compared to other European countries. In North America, Australia and New Zealand, controlled landfilling is continuing as a dominant method for large-scale waste disposal with mandated compliance to both landfilling and air-quality regulations. In parallel, larger quantities of landfill CH4 are annually being recovered, both to comply with air-quality regulations and to provide energy, assisted by national tax credits and local renewable-energy/green power initiatives (see Section 10.5 ). The US, Canada, Australia and other countries are currently studying and considering the widespread implementation of ‘bioreactor’ landfills to compress the time period during which high rates of CH4 generation occur ( Reinhart and Townsend, 1998 [NPR] ;( Reinhart et al., 2002; ) ( Berge et al., 2005 ) ); bioreactors will also require the early implementation of engineered gas extraction. Incineration has not been widely implemented in these countries due to historically low landfill tipping fees in many regions, negative public perceptions and high capital costs. In Japan, where open space is very limited for construction of waste management infrastructure, very high rates of both recycling and incineration are practised and are expected to continue into the future. Historically, there have also been ‘semi-aerobic’ Japanese landfills with potential for N2O generation ( (Tsujimoto et al., 1994 ) ). Similar aerobic (with air) landfill practices have also been studied or implemented in Europe and the US for reduced CH4 generation rates as an alternative to, or in combination with, anaerobic (without air) practices ( Ritzkowski and Stegmann, 2005 [NPR] ).
In many developing countries, current trends suggest that increases in controlled landfilling resulting in anaerobic decomposition of organic waste will be implemented in parallel with increased urbanization. For rapidly growing ‘mega cities’, engineered landfills provide a waste disposal solution that is more environmentally acceptable than open dumpsites and uncontrolled burning of waste. There are also persuasive public health reasons for implementing controlled landfilling – urban residents produce more solid waste per capita than rural inhabitants, and large amounts of uncontrolled refuse accumulating in areas of high population density are linked to vermin and disease ( Christensen, 1989 [NPR] ). The process of converting open dumping and burning to engineered landfills implies control of waste placement, compaction, the use of cover materials, implementation of surface water diversion and drainage, and management of leachate and gas, perhaps applying an intermediate level of technology consistent with limited financial resources ( Savage et al., 1998 [NPR, SRC] ). These practices shift the production of CO2 (by burning and aerobic decomposition) to anaerobic production of CH4. This is largely the same transition that occurred in many developed countries in the 1950 – 1970 time frame. Paradoxically, this results in higher rates of CH4 generation and emissions than previous open-dumping and burning practices. In addition, many developed and developing countries have historically implemented large-scale aerobic composting of waste. This has often been applied to mixed waste, which, in practice, is similar to implementing an initial aerobic MBT process. However, source-separated biodegradable waste streams are preferable to mixed waste in order to produce higher quality compost products for horticultural and other uses ( Diaz et al., 2002 [Ambiguous] ; Perla, 1997 [NPR] ). In developing countries, composting can provide an affordable, sustainable alternative to controlled landfilling, especially where more labour-intensive lower technology strategies are applied to selected biodegradable wastes ( Hoornweg et al., 1999 [NPR] ). It remains to be seen if mechanized recycling and more costly alternatives such as incineration and MBT will be widely implemented in developing countries. Where decisions regarding waste management are made at the local level by communities with limited financial resources seeking the least-cost environmentally acceptable solution – often this is landfilling or composting ( Hoornweg, 1999 [NPR] ; Hoornweg et al., 1999 [NPR] ; Johannessen and Boyer, 1999 [NPR] ). Accelerating the introduction of landfill gas extraction and utilization can mitigate the effect of increased CH4 generation at engineered landfills. Although Kyoto mechanisms such as CDM and JI have already proven useful in this regard, the post- 2012 situation is unclear.
With regard to wastewater trends, a current priority in developing countries is to increase the historically low rates of wastewater collection and treatment. One of the Millennium Development Goals (MDGs) is to reduce by 50% the number of people without access to safe sanitation by 2015 . One strategy may be to encourage more on-site sanitation rather than expensive transport of sewerage to centralized treatment plants: this strategy has been successful in Dakar, Senegal, at the cost of about 400 US$ per household. It has been estimated that, for sanitation, the annual investment must increase from 4 billion US$ to 18 billion US$ to achieve the MDG target, mostly in East Asia, South Asia and Sub-Saharan Africa (World Bank, 2005a [NPR] ).
10.3 Emission trends
10.3.1 Global overview
Quantifying global trends requires annual national data on waste production and management practices. Estimates for many countries are uncertain because data are lacking, inconsistent or incomplete; therefore, the standardization of terminology for national waste statistics would greatly improve data quality for this sector. Most developing countries use default data on waste generation per capita with inter-annual changes assumed to be proportional to total or urban population. Developed countries use more detailed methodologies, activity data and emission factors, as well as national statistics and surveys, and are sharing their methods through bilateral and multilateral initiatives.
For landfill CH4, the largest GHG emission from the waste sector, emissions continue several decades after waste disposal; thus, the estimation of emission trends requires models that include temporal trends. Methane is also emitted during wastewater transport, sewage treatment processes and leakages from anaerobic digestion of waste or wastewater sludges. The major sources of N2O are human sewage and wastewater treatment. The CO2 from the non-biomass portion of incinerated waste is a small source of GHG emissions. The IPCC 2006 [NPR] Guidelines also provide methodologies for CO2, CH4 and N2O emissions from open burning of waste and for CH4 and N2O emissions from composting and anaerobic digestion of biowaste. Open burning of waste in developing countries is a significant local source of air pollution, constituting a health risk for nearby communities. Composting and other biological treatments emit very small quantities of GHGs but were included in 2006 IPCC Guidelines for completeness.
Overall, the waste sector contributes <5% of global GHG emissions. Table 10.3 compares estimated emissions and trends from two studies: US EPA 2006 [NPR] and Monni et al. 2006 [NPR, SRC] ). The US EPA 2006 [NPR] ) study collected data from national inventories and projections reported to the United Nations Framework Convention on Climate Change (UNFCCC) and supplemented data gaps with estimates and extrapolations based on IPCC default data and simple mass balance calculations using the 1996 IPCC Tier 1 methodology for landfill CH4 Monni et al. 2006 [NPR, SRC] ) calculated a time series for landfill CH4 using the first-order decay (FOD) methodology and default data in the 2006 IPCC Guidelines, taking into account the time lag in landfill emissions compared to year of disposal. The estimates by Monni et al. 2006 [NPR, SRC] ) are lower than US EPA 2006 [NPR] ) for the period 1990 – 2005 because the former reflect slower growth in emissions relative to the growth in waste. However, the future projected growth in emissions by Monni et al. 2006 [NPR, SRC] ) is higher, because recent European decreases in landfilling are reflected more slowly in the future projections. For comparison, the reported 1995 CH4 emissions from landfills and wastewater from national inventories were approximately 1000 MtCO2eq ( UNFCCC, 2005 [NPR] ). In general, data from Non-Annex I countries are limited and usually available only for 1994 (or 1990 ). In the TAR, annual global CH4 and N2O emissions from all sources were approximately 600 Tg CH4/yr and 17.7 Tg N/yr as N2O ( IPCC, 2001b [NPR] ). The direct comparison of reported emissions in Table 10.3 with the SRES A1 and B2 scenarios ( Nakicenovic et al., 2000 [NPR, ARC] ) for GHG emissions from waste is problematical: the SRES do not include landfill-gas recovery (commercial since 1975 ) and project continuous increases in CH4 emissions based only on population increases to 2030 (AIB-AIM) or 2100 (B2-MESSAGE), resulting in very high emission estimates of >4000 MtCO2-eq/yr for 2050 .
Table 10.3: Trends for GHG emissions from waste using (a) 1996 and (b) 2006 IPCC inventory guidelines, extrapolations, and projections (MtCO2-eq, rounded)
| Source | 1990 | 1995 | 2000 | 2005 | 2010 | 2015 | 2020 | 2030 | 2050 |
|---|---|---|---|---|---|---|---|---|---|
| Landfill CH4a | 760 | 770 | 730 | 750 | 760 | 790 | 820 | ||
| Landfill CH4b | 340 | 400 | 450 | 520 | 640 | 800 | 1000 | 1500 | 2900 |
| Landfill CH4 (average of a and b) | 550 | 585 | 590 | 635 | 700 | 795 | 910 | ||
| Wastewater CH4a | 450 | 490 | 520 | 590 | 600 | 630 | 670 | ||
| Wastewater N2Oa | 80 | 90 | 90 | 100 | 100 | 100 | 100 | ||
| Incineration CO2b | 40 | 40 | 50 | 50 | 60 | 60 | 60 | 70 | 80 |
| Total GHG emissions | 1120 | 1205 | 1250 | 1345 | 1460 | 1585 | 1740 |
Table 10.3 indicates that total emissions have historically increased and will continue to increase ( Monni et al., 2006 [NPR, SRC] ; US EPA, 2006 [NPR] ; see also Scheehle and Kruger, 2006 [NPR] ). However, between 1990 and 2003, the percentage of total global GHG emissions from the waste sector declined 14–19% for Annex I and EIT countries ( UNFCCC, 2005 [NPR] ). The waste sector contributed 2–3% of the global GHG total for Annex I and EIT countries for 2003, but a higher percentage (4.3%) for non-Annex I countries (various reporting years from 1990 – 2000 ( UNFCCC, 2005 [NPR] ). In developed countries, landfill CH4 emissions are stabilizing due to increased landfill CH4 recovery, decreased landfilling, and decreased waste generation as a result of local waste management decisions including recycling, local economic conditions and policy initiatives. On the other hand, rapid increases in population and urbanization in developing countries are resulting in increases in GHG emissions from waste, especially CH4 from landfills and both CH4 and N2O from wastewater. CH4 emissions from wastewater alone are expected to increase almost 50% between 1990 and 2020, especially in the rapidly developing countries of Eastern and Southern Asia ( US EPA, 2006 [NPR] ; Table 10.3 ). Estimates of global N2O emissions from wastewater are incomplete and based only on human sewage treatment, but these indicate an increase of 25% between 1990 and 2020 ( Table 10.3 ). It is important to emphasize, however, that these are business-as-usual (BAU) scenarios, and actual emissions could be much lower if additional measures are in place. Future reductions in emissions from the waste sector will partially depend on the post- 2012 availability of Kyoto mechanisms such the CDM and JI.
Uncertainties for the estimates in Table 10.3 are difficult to assess and vary by source. According to 2006 IPCC Guidelines ( IPCC, 2006 [NPR] ), uncertainties can range from 10–30% (for countries with good annual waste data) to more than twofold (for countries without annual data). The use of default data and the Tier 1 mass balance method (from 1996 inventory guidelines) for many developing countries would be the major source of uncertainty in both the US EPA 2006 [NPR] ) study and reported GHG emissions ( IPCC, 2006 [NPR] ). Estimates by Monni et al. 2006 [NPR, SRC] ) were sensitive to the relationship between waste generation and GDP, with an estimated range of uncertainty for the baseline for 2030 of –48% to +24%. Additional sources of uncertainty include the use of default data for waste generation, plus the suitability of parameters and chosen methods for individual countries. However, although country-specific uncertainties may be large, the uncertainties by region and over time are estimated to be smaller.
10.3.2 Landfill CH4: regional trends
Landfill CH4 has historically been the largest source of GHG emissions from the waste sector. The growth in landfill emissions has diminished during the last 20 years due to increased rates of landfill CH4 recovery in many countries and decreased rates of landfilling in the EU. The recovery and utilization of landfill CH4 as a source of renewable energy was first commercialized in 1975 and is now being implemented at > 1150 plants worldwide with emission reductions of >105 MtCO2-eq/yr ( Willumsen, 2003 [NPR] ; Bogner and Matthews, 2003 [JoC, MoS, SRC] ). This number should be considered a minimum because there are also many sites that recover and flare landfill gas without energy recovery. Figure 10.5 compares regional emissions estimates for five-year intervals from 1990 – 2020 ( US EPA, 2006 [NPR] ) to annual historical estimates from 1971 – 2002 ( Bogner and Matthews, 2003 [JoC, MoS, SRC] ). The trends converge for Europe and the OECD Pacific, but there are differences for North America and Asia related to differences in methodologies and assumptions.
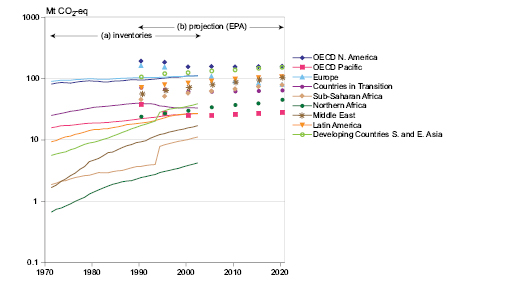
Figure 10.5: Regional landfill CH4 emission trends (MtCO2-eq).
Notes: Includes a) Annual historic emission trends from Bogner and Matthews 2003 [JoC, MoS, SRC] ), extended through 2002; b) Emission estimates for five-year intervals from 1990 – 2020 using 1996 inventory procedures, extrapolations and projections ( US EPA, 2006 [NPR] ).
A comparison of the present rate of landfill CH4 recovery to estimated global emissions ( Table 10.3 ) indicates that the minimum recovery and utilization rates discussed above (>105 MtCO2-eq yr) currently exceed the average projected increase from 2005 to 2010 . Thus, it is reasonable to state that landfill CH4 recovery is beginning to stabilize emissions from this source. A linear regression using historical data from the early 1980 s to 2003 indicates a conservative growth rate for landfill CH4 utilization of approximately 5% per year ( Bogner and Matthews, 2003 [JoC, MoS, SRC] ). For the EU-15, trends indicate that landfill CH4 emissions are declining substantially. Between 1990 and 2002, landfill CH4 emissions decreased by almost 30% ( Deuber et al., 2005 [NPR] ) due to the early implementation of the landfill directive ( 1999 /31/EC) and similar national legislation intended to both reduce the landfilling of biodegradable waste and increase landfill CH4 recovery at existing sites. By 2010, GHG emissions from waste in the EU are projected to be more than 50% below 1990 levels due to these initiatives ( EEA, 2004 [NPR, MoS] ).
For developing countries, as discussed in the previous section (10.3.1), rates of landfill CH4 emissions are expected to increase concurrently with increased landfilling. However, incentives such as the CDM can accelerate rates of landfill CH4 recovery and use in parallel with improved landfilling practices. In addition, since substantial CH4 can be emitted both before and after the period of active gas recovery, sites should be encouraged, where feasible, to install horizontal gas collection systems concurrent with filling and implement solutions to mitigate residual emissions after closure (such as landfill biocovers to microbially oxidize CH4—see section 10.4.2 ).
10.3.3 Wastewater and human sewage CH4 and N2O: regional trends
CH4 and N2O can be produced and emitted during municipal and industrial wastewater collection and treatment, depending on transport, treatment and operating conditions. The resulting sludges can also microbially generate CH4 and N2O, which may be emitted without gas capture. In developed countries, these emissions are typically small and incidental because of extensive infrastructure for wastewater treatment, usually relying on centralized treatment. With anaerobic processes, biogas is produced and CH4 can be emitted if control measures are lacking; however, the biogas can also be used for process heating or onsite electrical generation.
In developing countries, due to rapid population growth and urbanization without concurrent development of wastewater infrastructure, CH4 and N2O emissions from wastewater are generally higher than in developed countries. This can be seen by examining the 1990 estimated CH4 and N2O emissions and projected trends to 2020 from wastewater and human sewage (UNFCCC/IPCC, 2004; US EPA, 2006 [NPR] ). However, data reliability for many developing countries is uncertain. Decentralized ‘natural’ treatment processes and septic tanks in developing countries may also result in relatively large emissions of CH4 and N2O, particularly in China, India and Indonesia where wastewater volumes are increasing rapidly with economic development ( Scheehle and Doorn, 2003 [NPR, MoS] ).
The highest regional percentages for CH4 emissions from wastewater are from Asia (especially China, India). Other countries with high emissions in their respective regions include Turkey, Bulgaria, Iran, Brazil, Nigeria and Egypt. Total global emissions of CH4 from wastewater handling are expected to rise by more than 45% from 1990 to 2020 ( Table 10.3 ) with much of the increase from the developing countries of East and South Asia, the middle East, the Caribbean, and Central and South America. The EU has projected lower emissions in 2020 relative to 1990 ( US EPA, 2006 [NPR] ).
The contribution of human sewage to atmospheric N2O is very low with emissions of 80–100 MtCO2-eq/yr during the period 1990 – 2020 ( Table 10.3 ) compared to current total global anthropogenic N2O emissions of about 3500 MtCO2-eq ( US EPA, 2006 [NPR] ). Emission estimates for N2O from sewage for Asia, Africa, South America and the Caribbean are significantly underestimated since limited data are available, but it is estimated that these countries accounted for >70% of global emissions in 1990 (UNFCCC/IPCC, 2004 ). Compared with 1990, it is expected that global emissions will rise by about 20% by 2020 ( Table 10.3 ). The regions with the highest relative N2O emissions are the developing countries of East Asia, the developing countries of South Asia, Europe and the OECD North America ( Figure 10.6 b). Regions whose emissions are expected to increase the most by 2020 (with regional increases of 40 to 95%) are Africa, the Middle East, the developing countries of S and E Asia, the Caribbean, and Central and South America ( US EPA, 2006 [NPR] ). The only regions expected to have lower emissions in 2020 relative to 1990 are Europe and the EIT Countries.
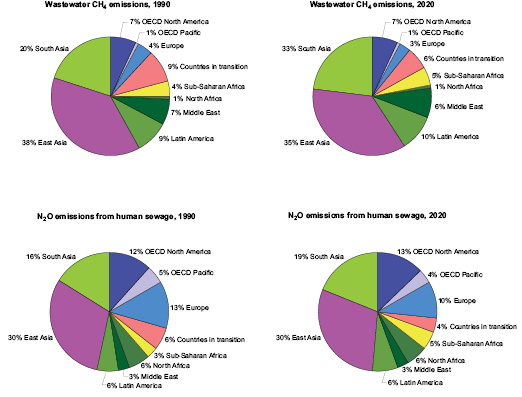
Figure 10.6a (upper): Regional distribution of CH4 emissions from wastewater and human sewage in 1990 and 2020 .
Figure 10.6b (lower): Regional distribution of N2O emissions from human sewage in 1990 and 2020 . See Table 10.3 for total emissions.
10.3.4 CO2 from waste incineration
Compared to landfilling, waste incineration and other thermal processes avoid most GHG generation, resulting only in minor emissions of CO2 from fossil C sources, including plastics and synthetic textiles. Estimated current GHG emissions from waste incineration are small, around 40 MtCO2-eq/yr, or less than one tenth of landfill CH4 emissions. Recent data for the EU-15 indicate CO2 emissions from incineration of about 9 MtCO2-eq/yr (EIPPC Bureau, 2006 ). Future trends will depend on energy price fluctuations, as well as incentives and costs for GHG mitigation. Monni et al. 2006 [NPR, SRC] ) estimated that incinerator emissions would grow to 80–230 MtCO2-eq/yr by 2050 (not including fossil fuel offsets due to energy recovery).
Major contributors to this minor source would be the developed countries with high rates of incineration, including Japan (>70% of waste incinerated), Denmark and Luxembourg (>50% of waste), as well as France, Sweden, the Netherlands and Switzerland. Incineration rates are increasing in most European countries as a result of the EU Landfill Directive. In 2003, about 17% of municipal solid waste was incinerated with energy recovery in the EU-25 (Eurostat, 2003; Statistics Finland, 2005 [NPR] ). More recent data for the EU-15 (EIPCC, 2006 ) indicate that 20–25% of the total municipal solid waste is incinerated at over 400 plants with an average capacity of about 500 t/d (range of 170– 1400 t/d). In the US, only about 14% of waste is incinerated ( US EPA, 2005 [NPR] ), primarily in the more densely populated eastern states. ( Thorneloe et al. 2002 ) ), using a life cycle approach, estimated that US plants reduced GHG emissions by 11 MtCO2-eq/yr when fossil-fuel offsets were taken into account.
In developing countries, controlled incineration of waste is infrequently practised because of high capital and operating costs, as well as a history of previous unsustainable projects. The uncontrolled burning of waste for volume reduction in these countries is still a common practice that contributes to urban air pollution ( Hoornweg, 1999 [NPR] ). Incineration is also not the technology of choice for wet waste, and municipal waste in many developing countries contains a high percentage of food waste with high moisture contents. In some developing countries, however, the rate of waste incineration is increasing. In China, for example, waste incineration has increased rapidly from 1.7% of municipal waste in 2000 to 5% in 2005 (including 67 plants). ( Du et al., 2006a [SRC] , 2006b; National Bureau of Statistics of China, 2006 ).
10.4 Mitigation of post-consumer emissions from waste
10.4.1 Waste management and GHG-mitigation technologies
A wide range of mature technologies is available to mitigate GHG emissions from waste. These technologies include landfilling with landfill gas recovery (reduces CH4 emissions), post-consumer recycling (avoids waste generation), composting of selected waste fractions (avoids GHG generation), and processes that reduce GHG generation compared to landfilling (thermal processes including incineration and industrial co-combustion, MBT with landfilling of residuals, and anaerobic digestion). Therefore, the mitigation of GHG emissions from waste relies on multiple technologies whose application depends on local, regional and national drivers for both waste management and GHG mitigation. There are many appropriate low- to high-technology strategies discussed in this section (see Figure 10.7 for a qualitative comparison of technologies). At the ‘high technology’ end, there are also advanced thermal processes for waste such as pyrolysis and gasification, which are beginning to be applied in the EU, Japan and elsewhere. Because of variable feedstocks and high unit costs, these processes have not been routinely applied to mixed municipal waste at large scale (thousands of tonnes per day). Costs and potentials are addressed in Section 10.4.7 .
10.4.2 CH4 management at landfills
Global CH4 emissions from landfills are estimated to be 500–800 MtCO2-eq/yr ( US EPA, 2006 [NPR] ; Monni et al. 2006 [NPR, SRC] ; Bogner and Matthews 2003 [JoC, MoS, SRC] ). However, direct field measurements of landfill CH4 emissions at small scale (<1m2) can vary over seven orders of magnitude (0.0001– > 1000 g CH4 /m2/d) depending on waste composition, cover materials, soil moisture, temperature and other variables ( Bogner et al., 1997a [SRC] ). Results from a limited number of whole landfill CH4 emissions measurements in Europe, the US and South Africa are in the range of about 0.1–1.0 tCH4/ha/d ( (Nozhevnikova et al., 1993; ) Oonk and Boom, 1995 [NPR] ; Borjesson, 1996 [NPR] ; Czepiel et al., 1996 [JoC] ;( Hovde et al., 1995; ) ( Mosher et al., 1999; ) ( Tregoures et al., 1999; ) ( Galle et al., 2001; ) Morris, 2001 [NPR] ; Scharf et al., 2002 [NPR, MoS] ).
The implementation of an active landfill gas extraction system using vertical wells or horizontal collectors is the single most important mitigation measure to reduce emissions. Intensive field studies of the CH4 mass balance at cells with a variety of design and management practices have shown that >90% recovery can be achieved at cells with final cover and an efficient gas extraction system ( Spokas et al., 2006 [SRC] ). Some sites may have less efficient or only partial gas extraction systems and there are fugitive emissions from landfilled waste prior to and after the implementation of active gas extraction; thus estimates of ‘lifetime’ recovery efficiencies may be as low as 20% ( Oonk and Boom, 1995 [NPR] ), which argues for early implementation of gas recovery. Some measures that can be implemented to improve overall gas collection are installation of horizontal gas collection systems concurrent with filling, frequent monitoring and remediation of edge and piping leakages, installation of secondary perimeter extraction systems for gas migration and emissions control, and frequent inspection and maintenance of cover materials. Currently, landfill CH4 is being used to fuel industrial boilers; to generate electricity using internal combustion engines, gas turbines or steam turbines; and to produce a substitute natural gas after removal of CO2 and trace components. Although electrical output ranges from small 30 kWe microturbines to 50 MWe steam turbine generators, most plants are in the 1–15 MWe range. Significant barriers to increased diffusion of landfill gas utilization, especially where it has not been previously implemented, can be local reluctance from electrical utilities to include small power producers and from gas utilities/pipeline companies to transport small percentages of upgraded landfill gas in natural gas pipelines.
A secondary control on landfill CH4 emissions is CH4 oxidation by indigenous methanotrophic microorganisms in cover soils. Landfill soils attain the highest rates of CH4 oxidation recorded in the literature, with rates many times higher than in wetland settings. CH4 oxidation rates at landfills can vary over several orders of magnitude and range from negligible to 100% of the CH4 flux to the cover. Under circumstances of high oxidation potential and low flux of landfill CH4 from the landfill, it has been demonstrated that atmospheric CH4 may be oxidized at the landfill surface ( Bogner et al., 1995 [SRC] ; 1997b; 1999; 2005; ( Borjesson and Svensson, 1997b ) ). In such cases, the landfill cover soils function as a sink rather than a source of atmospheric CH4. The thickness, physical properties moisture content, and temperature of cover soils directly affect oxidation, because rates are limited by the transport of CH4 upward from anaerobic zones and O2 downward from the atmosphere. Laboratory studies have shown that oxidation rates in landfill cover soils may be as high as 150–250 g CH4/m2/d ( (Kightley et al., 1995; ) de Visscher et al., 1999 [MoS] ). Recent field studies have demonstrated that oxidation rates can be greater than 200 g/m2/d in thick, compost-amended ‘biocovers’ engineered to optimize oxidation ( Bogner et al., 2005 [NPR, MoS, SRC] ; Huber-Humer, 2004 [NPR] ). The prototype biocover design includes an underlying coarse-grained gas distribution layer to provide more uniform fluxes to the biocover above ( Huber-Humer, 2004 [NPR] ). Furthermore, engineered biocovers have been shown to effectively oxidize CH4 over multiple annual cycles in northern temperate climates (Humer-Humer, 2004 ). In addition to biocovers, it is also possible to design passive or active methanotrophic biofilters to reduce landfill CH4 emissions ( (Gebert and Gröngröft, 2006; ) Streese and Stegmann, 2005 [NPR] ). In field settings, stable C isotopic techniques have proven extremely useful to quantify the fraction of CH4 that is oxidized in landfill cover soils ( Chanton and Liptay, 2000 [JoC] ; de Visscher et al., 2004 [JoC] ; Powelson et al., 2007 [2007] ). A secondary benefit of CH4 oxidation in cover soils is the co-oxidation of many non-CH4 organic compounds, especially aromatic and lower chlorinated compounds, thereby reducing their emissions to the atmosphere ( Scheutz et al., 2003a [SRC] ).
Other measures to reduce landfill CH4 emissions include installation of geomembrane composite covers (required in the US as final cover); design and installation of secondary perimeter gas extraction systems for additional gas recovery; and implementation of bioreactor landfill designs so that the period of active gas production is compressed while early gas extraction is implemented.
Landfills are a significant source of CH4 emissions, but they are also a long-term sink for carbon ( Bogner, 1992 [SRC] ; Barlaz, 1998 [JoC] . See Figure 10.1 and Box 10.1). Since lignin is recalcitrant and cellulosic fractions decompose slowly, a minimum of 50% of the organic carbon landfilled is not typically converted to biogas carbon but remains in the landfill (See references cited on Figure 10.1 ). Carbon storage makes landfilling a more competitive alternative from a climate change perspective, especially where landfill gas recovery is combined with energy use ( Flugsrud et al. 2001 [NPR, MoS, ARC] ;( Micales and Skog, 1997; ) ( Pingoud et al. 1996; ) Pipatti and Savolainen, 1996 [SRC] ; Pipatti and Wihersaari, 1998 [SRC] ). The fraction of carbon storage in landfills can vary over a wide range, depending on original waste composition and landfill conditions (for example, see Hashimoto and Moriguchi, 2004 [NPR, SRC] for a review addressing harvested wood products).
10.4.3 Incineration and other thermal processes for waste-to-energy
These processes include incineration with and without energy recovery, production of refuse-derived fuel (RDF), and industrial co-combustion (including cement kilns: see Onuma et al., 2004 [NPR] and Section 7.3.3 ). Incineration reduces the mass of waste and can offset fossil-fuel use; in addition, GHG emissions are avoided, except for the small contribution from fossil carbon ( Consonni et al., 2005 [MoS] ). Incineration has been widely applied in many developed countries, especially those with limited space for landfilling such as Japan and many European countries. Globally, about 130 million tonnes of waste are annually combusted in >600 plants in 35 countries ( (Themelis, 2003 ) ).
Waste incinerators have been extensively used for more than 20 years with increasingly stringent emission standards in Japan, the EU, the US and other countries. Mass burning is relatively expensive and, depending on plant scale and flue-gas treatment, currently ranges from about 95–150 €/t waste (87–140 US$/t) ( Faaij et al., 1998 [SRC] ; EIPPC Bureau, 2006 ). Waste-to-energy plants can also produce useful heat or electricity, which improves process economics. Japanese incinerators have routinely implemented energy recovery or power generation (Japan Ministry of the Environment, 2006 ). In northern Europe, urban incinerators have historically supplied fuel for district heating of residential and commercial buildings. Starting in the 1980 s, large waste incinerators with stringent emission standards have been widely deployed in Germany, the Netherlands and other European countries. Typically such plants have a capacity of about 1 Mt waste/yr, moving grate boilers (which allow mass burning of waste with diverse properties), low steam pressures and temperatures (to avoid corrosion) and extensive flue gas cleaning to conform with EU Directive 2000 /76/EC. In 2002, European incinerators for waste-to-energy generated 41 million GJ electrical energy and 110 million GJ thermal energy ( (Themelis, 2003 ) ). Typical electrical efficiencies are 15% to >20% with more efficient designs becoming available. In recent years, more advanced combustion concepts have penetrated the market, including fluidized bed technology.
10.4.4 Biological treatment including composting, anaerobic digestion, and MBT (Mechanical Biological Treatment)
Many developed and developing countries practise composting and anaerobic digestion of mixed waste or biodegradable waste fractions (kitchen or restaurant wastes, garden waste, sewage sludge). Both processes are best applied to source-separated waste fractions: anaerobic digestion is particularly appropriate for wet wastes, while composting is often appropriate for drier feedstocks. Composting decomposes waste aerobically into CO2, water and a humic fraction; some carbon storage also occurs in the residual compost (see references on Figure 10.1 ). Composting can be sustainable at reasonable cost in developing countries; however, choosing more labour-intensive processes over highly mechanized technology at large scale is typically more appropriate and sustainable; Hoornweg et al. 1999 [NPR] ) give examples from India and other countries. Depending on compost quality, there are many potential applications for compost in agriculture, horticulture, soil stabilization and soil improvement (increased organic matter, higher water-holding capacity) ( Cointreau, 2001 [NPR] ). However, CH4 and N2O can both be formed during composting by poor management and the initiation of semi-aerobic (N2O) or anaerobic (CH4) conditions; recent studies also indicate potential production of CH4 and N2O in well-managed systems ( (Hobson et al., 2005 ) ).
Anaerobic digestion produces biogas (CH4 + CO2) and biosolids. In particular, Denmark, Germany, Belgium and France have implemented anaerobic digestion systems for waste processing, with the resulting biogas used for process heating, onsite electrical generation and other uses. Minor quantities of CH4 can be vented from digesters during start-ups, shutdowns and malfunctions. However, the GHG emissions from controlled biological treatment are small in comparison to uncontrolled CH4 emissions from landfills without gas recovery (e.g. ( Petersen et al. 1998; ) ( Hellebrand 1998; ) Vesterinen 1996 [NPR] ; Beck-Friis, 2001 [NPR] ; Detzel et al. 2003 [NPR] ). The advantages of biological treatment over landfilling are reduced volume and more rapid waste stabilization. Depending on quality, the residual solids can be recycled as fertilizer or soil amendments, used as a CH4-oxidizing biocovers on landfills ( (Barlaz et al., 2004; ) Huber-Humer, 2004 [NPR] ), or landfilled at reduced volumes with lower CH4 emissions.
Mechanical biological treatment (MBT) of waste is now being widely implemented in Germany, Austria, Italy and other EU countries. In 2004, there were 15 facilities in Austria, 60 in Germany and more than 90 in Italy; the total throughput was approximately 13 million tonnes with larger plants having a capacity of 600– 1300 tonnes/day ( Diaz et al., 2006 [SRC] ). Mixed waste is subjected to a series of mechanical and biological operations to reduce volume and achieve partial stabilization of the organic carbon. Typically, mechanical operations (sorting, shredding, crushing) first produce a series of waste fractions for recycling or for subsequent treatment (including combustion or secondary biological processes). The biological steps consist of either aerobic composting or anaerobic digestion. Composting can occur either in open windrows or in closed buildings with gas collection and treatment. In-vessel anaerobic digestion of selected organic fractions produces biogas for energy use. Compost products and digestion residuals can have potential horticultural or agricultural applications; some MBT residuals are landfilled, or soil-like residuals can be used as landfill cover. Under landfill conditions, residual materials retain some potential for CH4 generation ( (Bockreis and Steinberg, 2005 ) ). Reductions of as much as 40–60% of the original organic carbon are possible with MBT ( Kaartinen, 2004 [NPR, MoS] ). Compared with landfilling, MBT can theoretically reduce CH4 generation by as much as 90% ( Kuehle-Weidemeier and Doedens, 2003 [NPR] ). In practice, reductions are smaller and dependent on the specific MBT processes employed (see Binner, 2002 [NPR] ).
10.4.5 Waste reduction, re-use and recycling
Quantifying the GHG-reduction benefits of waste minimization, recycling and re-use requires the application of LCA tools ( Smith et al., 2001 [NPR] ). Recycling reduces GHG emissions through lower energy demand for production (avoided fossil fuel) and by substitution of recycled feedstocks for virgin materials. Efficient use of materials also reduces waste. Material efficiency can be defined as a reduction in primary materials for a particular purpose, such as packaging or construction, with no negative impact on existing human activities. At several stages in the life cycle of a product, material efficiency can be increased by more efficient design, material substitution, product recycling, material recycling and quality cascading (use of recycled material for a secondary product with lower quality demands). Both material recycling and quality cascading occur in many countries at large scale for metals recovery (steel, aluminium) and recycling of paper, plastics and wood. All these measures lead to indirect energy savings, reductions in GHG emissions, and avoidance of GHG generation. This is especially true for products resulting from energy-intensive production processes such as metals, glass, plastic and paper ( Tuhkanen et al., 2001 [NPR, SRC] ).
The magnitude of avoided GHG-emissions benefits from recycling is highly dependent on the specific materials involved, the recovery rates for those materials, the local options for managing materials, and (for energy offsets) the specific fossil fuel avoided ( Smith et al., 2001 [NPR] ). Therefore, existing studies are often not comparable with respect to the assumptions and calculations employed. Nevertheless, virtually all developed countries have implemented comprehensive national, regional or local recycling programmes. For example, Smith et al. 2001 [NPR] ) thoroughly addressed the GHG-emission benefits from recycling across the EU, and Pimenteira et al. 2004 [NotFound] ) quantified GHG emission reductions from recycling in Brazil.
10.4.6 Wastewater and sludge treatment
There are many available technologies for wastewater management, collection, treatment, re-use and disposal, ranging from natural purification processes to energy-intensive advanced technologies. Although decision-making tools are available that include environmental trade-offs and costs ( Ho, 2000 [NPR] ), systematic global studies of GHG-reduction potentials and costs for wastewater are still needed. When efficiently applied, wastewater transport and treatment technologies reduce or eliminate GHG generation and emissions; in addition, wastewater management promotes water conservation by preventing pollution, reducing the volume of pollutants, and requiring a smaller volume of water to be treated. Because the size of treatment systems is primarily governed by the volume of water to be treated rather than the mass loading of nitrogen and other pollutants, smaller volumes mean that smaller treatment plants with lower capital costs can be more extensively deployed. Wastewater collection and transport includes conventional (deep) sewerage and simplified (shallow) sewerage. Deep sewerage in developed countries has high capital and operational costs. Simplified (shallow) sewerage in both developing and developed countries uses smaller-diameter piping and shallower excavations, resulting in lower capital costs (30–50%) than deep systems.
Wastewater treatment removes pollutants using a variety of technologies. Small wastewater treatment systems include pit latrines, composting toilets and septic tanks. Septic tanks are inexpensive and widely used in both developed and developing countries. Improved on-site treatment systems used in developing countries include inverted trench systems and aerated treatment units. More advanced treatment systems include activated sludge treatment, trickling filters, anaerobic or facultative lagoons, anaerobic digestion and constructed wetlands. Depending on scale, many of these systems have been used in both developed and developing countries. Activated sludge treatment is considered the conventional method for large-scale treatment of sewage. In addition, separation of black water and grey water can reduce the overall energy requirements for treatment (UNEP/GPA-UNESCO/IHE, 2004 ). Pretreatment or limitation of industrial wastes is often necessary to limit excessive pollutant loads to municipal systems, especially when wastewaters are contaminated with heavy metals. Sludges (or biosolids) are the product of most wastewater treatment systems. Options for sludge treatment include stabilization, thickening, dewatering, anaerobic digestion, agricultural re-use, drying and incineration. The use of composted sludge as a soil conditioner in agriculture and horticulture recycles carbon, nitrogen and phosphorus (and other elements essential for plant growth). Heavy metals and some toxic chemicals are difficult to remove from sludge; either the limitation of industrial inputs or wastewater pretreatment is needed for agricultural use of sludges. Lower quality uses for sludge may include mine site rehabilitation, highway landscaping, or landfill cover (including biocovers). Some sludges are landfilled, but this practice may result in increased volatile siloxanes and H2S in the landfill gas. Treated wastewater can either be re-used or discharged, but re-use is the most desirable option for agricultural and horticultural irrigation, fish aquaculture, artificial recharge of aquifers, or industrial applications.
10.4.7 Waste management and mitigation costs and potentials
In the waste sector, it is often not possible to clearly separate costs for GHG mitigation from costs for waste management. In addition, waste management costs can exhibit high variability depending on local conditions. Therefore the baseline and cost assumptions, local availability of technologies, and economic and social development issues for alternative waste management strategies need to be carefully defined. An older study by de Jager and Blok 1996 [ARC] ) assumed a 20-year project life to compare the cost-effectiveness of various options for mitigating CH4 emissions from waste in the Netherlands, with costs ranging from –2 US$/tCO2-eq for landfilling with gas recovery and on-site electrical generation to >370 US$/tCO2-eq for incineration. In general, for landfill CH4 recovery and utilization, project economics are highly site-specific and dependent on the financial arrangements as well as the distribution of benefits, risks and responsibilities among multiple partners. Some representative unit costs for landfill-gas recovery and utilization (all in 2003 US$/kW installed power) are: 200–400 for gas collection; 200–300 for gas conditioning (blower/compressor, dehydration, flare); 850– 1200 for internal combustion engine/generator; and 250–350 for planning and design ( Willumsen, 2003 [NPR] ).
Smith et al. 2001 [NPR] ) highlighted major cost differences between EU member states for mitigating GHG emissions from waste. Based on fees (including taxes) for countries with data, this study compared emissions and costs for various waste management practices with respect to direct GHG emissions, carbon sequestration, transport emissions, avoided emissions from recycling due to material and energy savings, and avoided emissions from fossil-fuel substitution via thermal processes and biogas (including landfill gas). Recycling costs are highly dependent on the waste material recycled. Overall, the financial success of any recycling venture is dependent on the current market value of the recycled products. The price obtained for recovered materials is typically lower than separation/reprocessing costs, which can be, in turn, higher than the cost of virgin materials – thus recycling activities usually require subsidies (except for aluminium and paper recycling). Recycling, composting and anaerobic digestion can provide large potential emission reductions, but further implementation is dependent on reducing the cost of separate collection (10–400 €/t waste (9–380 US$/t)) and, for composting, establishing local markets for the compost product. Costs for composting can range from 20–170 €/t waste (18–156 US$/t) and are typically 35 €/t waste (32 US$/t) for open-windrow operations and 50 €/t waste (46 US$/t) for in-vessel processes. When the replaced fossil fuel is coal, both mass incineration and co-combustion offer comparable and less expensive GHG-emission reductions compared to recycling (averaging 64 €/t waste (59 US$/t), with a range of 30–150 €/t (28–140 US$/t)). Landfill disposal is the most inexpensive waste management option in the EU (averaging 56 €/t waste (52 US$/t), ranging from 10–160 €/t waste (9–147 US$/t), including taxes), but it is also the largest source of GHG emissions. With improved gas management, landfill emissions can be significantly reduced at low cost. However, landfilling costs in the EU are increasing due to increasingly stringent regulations, taxes and declining capacity. Although there is only sparse information regarding MBT costs, German costs are about 90 €/t waste (83 US$/t, including landfill disposal fees); recent data suggest that, in the future, MBT may become more cost-competitive with landfilling and incineration.
Costs and potentials for reducing GHG emissions from waste are usually based on landfill CH4 as the baseline ( Bates and Haworth, 2001 [NPR] ; Delhotal et al. 2006 [NPR, MoS, ARC] ; Monni et al. 2006 [NPR, SRC] ; Nakicenovic et al., 2000 [NPR, ARC] ; Pipatti and Wihersaari 1998 [SRC] ). When reporting to the UNFCCC, most developed countries take the dynamics of landfill gas generation into account; however, most developing countries and non-reporting countries do not. Basing their study on reported emissions and projections, Delhotal et al. 2006 [NPR, MoS, ARC] ) estimated break-even costs for GHG abatement from landfill gas utilization that ranged from about –20 to +70 US$/tCO2-eq, with the lower value for direct use in industrial boilers and the higher value for on-site electrical generation. From the same study, break-even costs (all in US$/tCO2-eq) were approximately 25 for landfill-gas flaring; 240–270 for composting; 40–430 for anaerobic digestion; 360 for MBT and 270 for incineration. These costs were based on the EMF-21 study ( US EPA, 2003 [NPR, MoS] ), which assumed a 15-year technology lifetime, 10% discount rate and 40% tax rate.
Compared to thermal and biological processes which only affect future emissions, landfill CH4 is generated from waste landfilled in previous decades, and gas recovery, in turn, reduces emissions from waste landfilled in previous years. Most existing studies for the waste sector do not consider these temporal issues Monni et al. 2006 [NPR, SRC] ) developed baseline and mitigation scenarios for solid waste management using the first order decay (FOD) methodology in the 2006 IPCC Guidelines, which takes into account the timing of emissions. The baseline scenario by Monni et al. 2006 [NPR, SRC] ) assumed that: 1) waste generation will increase with growing population and GDP (using the same population and GDP data as SRES scenario A1b); 2) waste management strategies will not change significantly, and 3) landfill gas recovery and utilization will continue to increase at the historical rate of 5% per year in developed countries ( Bogner and Matthews, 2003 [JoC, MoS, SRC] ; Willumsen, 2003 [NPR] ). Mitigation scenarios were developed for 2030 and 2050 which focus on increased landfill gas recovery, increased recycling, and increased incineration. In the increased landfill gas recovery scenario, recovery was estimated to increase 15% per year, with most of the increase in developing countries because of CDM or similar incentives (above baseline of current CDM projects). This growth rate is about triple the current rate and corresponds to a reasonable upper limit, taking into account the fact that recovery in developed countries has already reached high levels, so that increases would come mainly from developing countries, where current lack of funding is a barrier to deployment. Landfill gas recovery was capped at 75% of estimated annual CH4 generation for developed countries and 50% for developing countries in both the baseline and increased landfill gas recovery scenarios. In the increased incineration scenario, incineration grew 5% each year in the countries where waste incineration occurred in 2000 . For OECD countries where no incineration took place in 2000, 1% of the waste generated was assumed to be incinerated in 2012 . In non-OECD countries, 1% waste incineration was assumed to be reached only in 2030 . The maximum rate of incineration that could be implemented was 85% of the waste generated. The increased recycling scenario assumed a growth in paper and cardboard recycling in all parts of the world using a technical maximum of 60% recycling ( CEPI, 2003 [NPR] ). This maximum was assumed to be reached in 2050 . In the mitigation scenarios, only direct emission reductions compared to the baseline CH4 emissions from landfills were estimated – thus avoided emissions from recycled materials, reduced energy use, or fossil fuel offsets were not included. In the baseline scenario ( Figure 10.8 ), emissions increase threefold during the period from 1990 to 2030 and more than fivefold by 2050 . These growth rates do not include current or planned legislation relating to either waste minimization or landfilling – thus future emissions may be overestimated. Most of the increase comes from non-OECD countries whose current emissions are smaller because of lower waste generation and a higher percentage of waste degrading aerobically. The mitigation scenarios show that reductions by individual measures in 2030 range from 5–20% of total emissions and increase proportionally with time. In 2050, the corresponding range is approximately 10–30%. As the measures in the scenarios are largely additive, total mitigation potentials of approximately 30% in 2030 and 50% in 2050 are projected relative to the baseline. Nevertheless, the estimated abatement potential is not capable of mitigating the growth in emissions.
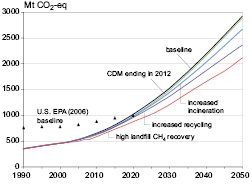
Figure 10.8: Global CH4 emissions from landfills in baseline scenario compared to the following mitigation scenarios: increased incineration, CDM ending by 2012 (end of the first Kyoto commitment period), increased recycling, and high landfill CH4 recovery rates including continuation of CDM after 2012 ( Monni et al., 2006 [NPR, SRC] ). The emission reductions estimated in the mitigation scenarios are largely additional to 2050 . This figure also includes the US EPA 2006 [NPR] ) baseline scenario for landfill CH4 emissions from Delhotal et al. 2006 [NPR, MoS, ARC] ).
The baseline emission estimates in the Delhotal et al. 2006 [NPR, MoS, ARC] ) study are based on similar assumptions to the Monni et al. 2006 [NPR, SRC] ) study: population and GDP growth with increasing amounts of landfilled waste in developing countries. Baselines also include documented or expected changes in disposal rates due to composting and recycling, as well as the effects of landfill-gas recovery. In Delhotal et al. 2006 [NPR, MoS, ARC] ), emissions increase by about 30% between 2000 and 2020; therefore, the growth in emissions to 2020 is more moderate than in Monni et al. 2006 [NPR, SRC] ). This more moderate growth can be attributed to the inclusion of current and planned policies and measures to reduce emissions, plus the fact that historical emissions from prior landfilled waste were only partially considered.
Scenario development in both studies was complemented with estimates on maximum mitigation potentials at given marginal cost levels using the baseline scenarios as the starting point. Monni et al. 2006 [NPR, SRC] ) derived annual regional waste-generation estimates for the Global Times model by using static aggregate emission coefficients calibrated to regional FOD models. Some modifications to the assumptions used in the scenario development were also made; for example, recycling was excluded due to its economic complexity, biological treatment was included and the technical efficiency of landfill-gas recovery was assumed the same in all regions (75%). Cost data were taken from various sources (de Feber & Gielen, 2000 [NotFound] ; OECD, 2004 [NPR] ; Hoornweg, 1999 [NPR] ).
As in the EMF-21 study ( US EPA, 2003 [NPR, MoS] ), both Delhotal et al. 2006 [NPR, MoS, ARC] and Monni et al. 2006 [NPR, SRC] ) assumed the same capital costs for all regions, but used regionalized labour costs for operations and maintenance.
Delhotal et al. 2006 [NPR, MoS, ARC] and Monni et al. 2006 [NPR, SRC] ) both conclude that substantial emission reductions can be achieved at low or negative costs (see Table 10.4 ). At higher costs, more significant reductions would be possible (more than 80% of baseline emissions) with most of the additional mitigation potential coming from thermal processes for waste-to-energy. Since combustion of waste results in minor fossil CO2 emissions, these were considered in the calculations, but Table 10.4 only includes emissions reductions from landfill CH4. In general, direct GHG emission reductions from implementation of thermal processes are much less than indirect reductions due to fossil fuel replacement, where that occurs. The emission reduction potentials for 2030 shown in Table 10.4 are assessed using a steady-state approach that can overestimate near-term annual reductions but gives more realistic values when integrated over time.
Table 10.4: Economic reduction potential for CH4 emissions from landfilled waste by level of marginal costs for 2020 and 2030 based on steady state modelsa.
| US$/tCO2-equivalent | |||||
|---|---|---|---|---|---|
| 2020 | 0 | 15 | 30 | 45 | 60 |
| (Delhotal et al., 2006) | |||||
| OECD | 12% | 40% | 46% | 67% | 92% |
| EIT | NA | NA | NA | NA | NA |
| Non-OECD | NA | NA | NA | NA | NA |
| Global | 12% | 41% | 50% | 57% | 88% |
| 2030 | 0 | 10 | 20 | 50 | 100 |
| (Monni et al., 2006) | |||||
| OECD | 48% | 86% | 89% | 94% | 95% |
| EIT | 31% | 80% | 93% | 99% | 100% |
| Non-OECD | 32% | 38% | 50% | 77% | 88% |
| Global | 35% | 53% | 63% | 83% | 91% |
The economic mitigation potentials for the year 2030 in Table 10.5 take the dynamics of landfill gas generation into account. These estimates are derived from the static, long-term mitigation potentials previously shown in Table 10.4 ( Monni et al. 2006 [NPR, SRC] ). The upper limits of the ranges assume that landfill disposal is limited in the coming years so that only 15% of the waste generated globally is landfilled after 2010 . This would mean that by 2030 the maximum economic potential would be almost 70% of the global emissions (see Table 10.5 ). The lower limits of the table have been scaled down to reflect a more realistic timing of implementation in accordance with emissions in the high landfill gas recovery (HR) and increased incineration (II) scenarios ( Monni et al., 2006 [NPR, SRC] ).
Table 10.5: Economic potential for mitigation of regional landfill CH4 emissions at various cost categories in 2030 (from estimates by Monni et al., 2006 [NPR, SRC] ). See notes.
| Region | Projected emissions for 2030 | Total economic mitigation potential (MtCO2-eq) | Economic mitigation potential (MtCO2-eq) at various cost categories (US$/tCO2-eq) | |||
|---|---|---|---|---|---|---|
| at <100 US$/tCO2-eq | ||||||
| <0 | 0-20 | 20-50 | 50-100 | |||
| OECD | 360 | 100-200 | 100-120 | 20-100 | 0-7 | 1 |
| EIT | 180 | 100 | 30-60 | 20-80 | 5 | 1-10 |
| Non-OECD | 960 | 200-700 | 200-300 | 30-100 | 0-200 | 0-70 |
| Global | 1500 | 400-1000 | 300-500 | 70-300 | 5-200 | 10-70 |
It must be emphasized that there are large uncertainties in costs and potentials for mitigation of GHG emissions from waste due to the uncertainty of waste statistics for many countries and emissions methodologies that are relatively unsophisticated. It is also important to point out that the cost estimates are global averages and therefore not necessarily applicable to local conditions.
10.4.8 Fluorinated gases: end-of-life issues, data and trends in the waste sector
The CFCs and HCFCs regulated as ozone-depleting substances (ODS) under the Montreal Protocol can persist for many decades in post-consumer waste and occur as trace components in landfill gas ( Scheutz et al., 2003 [Ambiguous] ). The HFCs regulated under the Kyoto Protocol are promoted as substitutions for the ODS. High global-warming potential (GWP) fluorinated gases have been used for more than 70 years; the most important are the chlorofluorocarbons (CFCs), hydrochlorofluorocarbons (HCFCs) and the hydrofluorocarbons (HFCs) with the existing bank of CFCs and HCFCs estimated to be >1.5 Mt and 0.75 Mt, respectively (TFFEoL, 2005; IPCC, 2005 [NPR] ). These gases have been used as refrigerants, solvents, blowing agents for foams and as chemical intermediates. End-of-life issues in the waste sector are mainly relevant for the foams; for other products, release will occur during use or just after end-of-life. For the rigid foams, releases during use are small ( Kjeldsen and Jensen, 2001 [SRC] , Kjeldsen and Scheutz, 2003 [SRC] , Scheutz et al, 2003b [NPR, SRC] ), so most of the original content is still present at the end of their useful life. The rigid foams include polyurethane and polystyrene used as insulation in appliances and buildings; in these, CFC-11 and CFC-12 were the main blowing agents until the mid- 1990 s. After the mid- 1990 s, HCFC-22, HCFC-141b and HCFC-142b with HFC-134a have been used ( CALEB, 2000 [NPR] ). Considering that home appliances are the foam-containing product with the lowest lifetime (average maximum lifetime 15 years, TFFEoL, 2005 ), a significant fraction of the CFC-11 in appliances has already entered waste management systems. Building insulation has a much longer lifetime (estimated to 30-80 years, ( Gamlen et al., 1986 ) ) and most of the fluorinated gases in building insulation have not yet reached the end of their useful life (TFFEoL, 2005 Daniel et al. 2007 [PoC, JoC, MoS, ARC, 2007] ) discuss the uncertainties and some possible temporal trends for depletion of CFC-11 and CFC-12 banks.
Consumer products containing fluorinated gases are managed in different ways. After 2001, landfill disposal of appliances was prohibited in the EU ( IPCC, 2005 [NPR] ), resulting in appliance-recycling facilities. A similar system was established in Japan in 2001 ( IPCC, 2005 [NPR] ). For other developed countries, appliance foams are often buried in landfills, either directly or following shredding and metals recycling. For rigid foams, shredding results in an instantaneous release with the fraction released related to the final particle size ( Kjeldsen and Scheutz, 2003 [SRC] ). A recent study estimating CFC-11 releases after shredding at three American facilities showed that 60–90% of the CFC remains and is slowly released following landfill disposal (Scheutz et al., 2005a [NotFound] ). In the US and other countries, appliances typically undergo mechanical recovery of ferrous metals with landfill disposal of residuals. A study has shown that 8–40% of the CFC-11 is lost during segregation ( Scheutz et al., 2002 [NPR, SRC] ; Fredenslund et al., 2005 [NPR, SRC] ). Then, during landfilling, the compactors shred residual foam materials and further enhance instantaneous gaseous releases.
In the anaerobic landfill environment, some fluorinated gases may be biodegraded because CFCs and, to some extent, HCFCs can undergo dechlorination ( Scheutz et al., 2003b [NPR, SRC] ). Potentially this may result in the production of more toxic intermediate degradation products (e.g., for CFC-11, the degradation products can be HCFC-21 and HCFC-31). However, recent laboratory experiments have indicated rapid CFC-11 degradation with only minor production of toxic intermediates (Scheutz et al., 2005b [NotFound] ). HFCs have not been shown to undergo either anaerobic or aerobic degradation. Thus, landfill attenuation processes may decrease emissions of some fluorinated gases, but not of others. However, data are entirely lacking for PFCs, and field studies are needed to verify that CFCs and HCFCs are being attenuated in situ in order to guide future policy decisions.
10.4.9 Air quality issues: NMVOCs and combustion emissions
Landfill gas contains trace concentrations of aromatic, chlorinated and fluorinated hydrocarbons, reduced sulphur gases and other species. High hydrocarbon destruction efficiencies are typically achieved in enclosed flares (>99%), which are recommended over lower-efficiency open flares. Hydrogen sulphide is mainly a problem at landfills which co-dispose large quantities of construction and demolition debris containing gypsum board. Emissions of NOx can sometimes be a problem for permitting landfill gas engines in strict air quality regions.
At landfill sites, recent field studies have indicated that NMVOC fluxes through final cover materials are very small with both positive and negative fluxes ranging from approximately 10-8 to 10-4 g/m/d for individual species ( Scheutz et al., 2003a [SRC] ; Bogner et al., 2003 [Ambiguous] ;( Barlaz et al., 2004 ) ). In general, the emitted compounds consist of species recalcitrant to aerobic degradation (especially higher chlorinated compounds), while low to negative emissions (uptake from the atmosphere) are observed for species which are readily degradable in aerobic cover soils, such as the aromatics and vinyl chloride ( Scheutz et al., 2003a [SRC] ).
Uncontrolled emissions resulting from waste incineration are not permitted in developed countries, and incinerators are equipped with advanced emission controls. Modern incinerators must meet stringent emission-control standards in Japan, the EU, the US and other developed countries (EIPPC Bureau, 2006 ). For reducing incinerator emissions of volatile heavy metals and dioxins/dibenzofurans, the removal of batteries, other electronic waste and polyvinyl chloride (PVC) plastics is recommended prior to combustion (EIPPC Bureau, 2006 ).
10.5 Policies and measures: waste management and climate
GHG emissions from waste are directly affected by numerous policy and regulatory strategies that encourage energy recovery from waste, restrict choices for ultimate waste disposal, promote waste recycling and re-use, and encourage waste minimization. In many developed countries, especially Japan and the EU, waste-management policies are closely related to and integrated with climate policies. Although policy instruments within the waste sector consist mainly of regulations, there are also economic measures to promote recycling, waste minimization and selected waste management technologies. In industrialized countries, waste minimization and recycling are encouraged through both policy and regulatory drivers. In developing countries, major policies are aimed at restricting the uncontrolled dumping of waste. Table 10.6 provides an overview of policies and measures, some of which are discussed below.
Table 10.6: Examples of policies and measures for the waste management sector.
| Policies and measures | Activity affected | GHG affected | Type of instruments |
|---|---|---|---|
| Reducing landfill CH4 emissions | |||
| Standards for landfill performance to reduce landfill CH4 emissions by capture and combustion of landfill gas with or without energy recovery | Management of landfill sites | CH4 | Regulation |
| Economic Incentive | |||
| Reduction in biodegradable waste that is landfilled. | Disposal of biodegradable waste | CH4 | Regulation |
| Promoting incineration and other thermal processes for waste-to-energy | |||
| Subsidies for construction of incinerator combined with standards for energy efficiency | Performance standards for incinerators | CO2 | Regulation |
| CH4 | |||
| Tax exemption for electricity generated by waste incineration with energy recovery | Energy recovery from incineration of waste | CO2 | Economic incentive |
| CH4 | |||
| Promoting waste minimization, re-use and recovery | |||
| Extended Producer Responsibility (EPR) | Manufacture of products | CO2 | Regulation |
| Recovery of used products | CH4 | Voluntary | |
| Disposal of waste | Fluorinated gases | ||
| Unit pricing / Variable rate pricing / Pay-as-you-throw (PAYT) | Recovery of used products | CO2 | Economic incentive |
| Disposal of waste | CH4 | ||
| Landfill tax | Recovery of used products | CO2 | Regulation |
| Disposal of waste | CH4 | ||
| Separate collection and recovery of specific waste fractions | Recovery of used products | CO2 | Subsidy |
| Disposal of waste | CH4 | ||
| Promotion of the use of recycled products | Manufacturing of products | CO2 | Regulation |
| CH4 | Voluntary | ||
| Wastewater and sludge treatment | |||
| Collection of CH4 from wastewater treatment system | Management of wastewater treatment system | CH4 | Regulation |
| Voluntary | |||
| Post-consumer management of fluorinated gases | |||
| Substitutes for gases used commercially | Production of fluorinated gases | Fluorinated gases | Regulation |
| Economic incentive | |||
| Voluntary | |||
| Collection of fluorinated gases from end-of-life products | Management of end-of-life products | Fluorinated gases | Regulation |
| Voluntary | |||
| JI and CDM in waste management sector | |||
| JI and CDM | Landfill gas and biogas recovery | CO2 | Kyoto mechanism |
| CH4 | |||
10.5.1 Reducing landfill CH4 emissions
There are two major strategies to reduce landfill CH4 emissions: implementation of standards that require or encourage landfill CH4 recovery and a reduction in the quantity of biodegradable waste that is landfilled. In the US, landfill CH4 emissions are regulated indirectly under the Clean Air Act (CAA) Amendments/New Source Performance Standards (NSPS) by applying a landfill-gas generation model, either measured or default mixing ratios for total non-methane organic compounds (NMOCs), and restricting the emissions of NMOCs. Larger quantities of landfill CH4 are also being annually recovered to both comply with air-quality regulations and provide energy, assisted by national tax credits and local renewable-energy/green-power initiatives. As discussed above, the EU landfill directive ( 1999 /31/EC) requires a phased reduction in landfilled biodegradable waste to 50% of 1995 levels by 2009 and 35% by 2016, as well as the collection and flaring of landfill gas at existing sites (Commission of the European Community, 2001 ). However, increases in the availability of landfill alternatives (recycling, composting, incineration, anaerobic digestion and MBT) are required to achieve these regulatory goals ( (Price, 2001 ) ).
Landfill CH4 recovery has also been encouraged by economic and regulatory incentives. In the UK, for example, the Non Fossil Fuel Obligation, requiring a portion of electrical generation capacity from non-fossil sources, provided a major incentive for landfill gas-to-electricity projects during the 1980 s and 1990 s. It has now been replaced by the Renewables Obligation. In the US, as mentioned above, the implementation of CAA regulations in the early 1990 s provided a regulatory driver for gas recovery at large landfills; in parallel, the US EPA Landfill Methane Outreach Program provides technical support, tools and resources to facilitate landfill gas utilization projects in the US and abroad. Also, periodic tax credits in the US have provided an economic incentive for landfill gas utilization – for example, almost 50 of the 400+ commercial projects in the US started up in 1998, just before the expiration of federal tax credits. A small US tax credit has again become available for landfill gas and other renewable energy sources; in addition, some states also provide economic incentives through tax structures or renewable energy credits and bonds. Other drivers include state requirements that a portion of electrical energy be derived from renewables, green-power programmes (which allow consumers to select renewable providers), regional programmes to reduce GHG emissions (the RGGI/ Regional GHG Initiative in the northeastern states; a state programme in California) and voluntary markets (such as the Chicago Climate Exchange with binding commitments by members to reduce GHG emissions).
In non-Annex I countries, it is anticipated that landfill CH4 recovery will increase significantly in the developing countries of Asia, South America and Africa during the next two decades as controlled landfilling is phased in as a major waste-disposal strategy. Where this occurs in parallel with deregulated electrical markets and more decentralized electrical generation, it can provide a strong driver for increased landfill CH4 recovery with energy use. Significantly, both JI in the EIT countries and the recent availability of the Clean Development Mechanism (CDM) in developing countries are providing strong economic incentives for improved landfilling practices (to permit gas extraction) and landfill CH4 recovery. Box 10.2 summarizes the important role of landfill CH4 recovery within CDM and gives an example of a successful project in Brazil.
10.5.2 Incineration and other thermal processes for waste-to-energy
Thermal processes can efficiently exploit the energy value of post-consumer waste, but the high cost of incineration with emission controls restricts its sustainable application in many developing countries. Subsidies for construction of incinerators have been implemented in several countries, usually combined with standards for energy efficiency (Austrian Federal Government,Thermal processes can efficiently exploit the energy value of post-consumer waste, but the high cost of incineration with emission controls restricts its sustainable application in many developing countries. Subsidies for construction of incinerators have been implemented in several countries, usually combined with standards for energy efficiency (Austrian Federal Government, Government of Japan, 1997 ). Tax exemptions for electricity generated by waste incinerators (Government of the Netherlands, 2001 ) and for waste disposal with energy recovery (Government of Norway, 2002 ) have been adopted. In Sweden, it has been illegal to landfill pre-sorted combustible waste since 2002 (Swedish Environmental Protection Agency, 2005 ). Landfill taxes have also been implemented in a number of EU countries to elevate the cost of landfilling to encourage more costly alternatives (incineration, industrial co-combustion, MBT). In the UK, the landfill tax has also been used as a funding mechanism for environmental and community projects, as discussed by ( Morris et al. 2000 ) ( and Grigg and Read 2001 ) ).
Separate and efficient collection of recyclable materials is needed with both PAYT and landfill tax systems. For kerbside programmes, the percentage recycled is related to the efficiency of kerbside collection and the duration of the programme ( (Jenkins et al., 2003 ) ). Other policies and measures include local subsidies and educational programmes for collection of recyclables, domestic composting of biodegradable waste and procurement of recycled products (green procurement). In the US, for example, 21 states have requirements for separate collection of garden (green) waste, which is diverted to composting or used as an alternative daily cover on landfills.
10.5.3 Waste minimization, re-use and recycling
Widely implemented policies include Extended Producer Responsibility (EPR), unit pricing (or PAYT/Pay As You Throw) and landfill taxes. Waste reduction can also be promoted by recycling programmes, waste minimization and other measures ( (Miranda et al., 1994; ) ( Fullerton and Kinnaman, 1996 ) ). The EPR regulations extend producer responsibility to the post-consumer period, thus providing a strong incentive to redesign products using fewer materials as well as those with increased recycling potential ( OECD, 2001 [NPR] ). Initially, EPR programmes were reported to be expensive ( (Hanisch, 2000 ) ), but the EPR concept is very broad: a number of successful schemes have been implemented in various countries for diverse waste fractions such as packaging waste, old vehicles and electronic equipment. EPR programmes range in complexity and cost, but waste reductions have been reported in many countries and regions. In Germany, the 1994 Closed Substance Cycle and Waste Management Act, other laws and voluntary agreements have restructured waste management over the past 15 years ( Giegrich and Vogt, 2005 [NPR] ).
Unit pricing has been widely adopted to decrease landfilled waste and increase recycling ( Miranda et al., 1996 [NPR] ). Some municipalities have reported a secondary increase in waste generation after an initial decrease following implementation of unit pricing, but the ten-year sustainability of these programmes has been demonstrated ( (Yamakawa and Ueta, 2002 ) ).
10.5.4 Policies and measures on fluorinated gases
The HFCs regulated under the Kyoto Protocol substitute for the ODS. A number of countries have adopted collection systems for products still in use based on voluntary agreements (Austrian Federal Government,The HFCs regulated under the Kyoto Protocol substitute for the ODS. A number of countries have adopted collection systems for products still in use based on voluntary agreements (Austrian Federal Government,) or EPR regulations for appliances (Government of Japan, 2002 ). Both the EU and Japan have successfully prohibited landfill disposal of appliances containing ODS foams after 2001 (TFFEoL, 2005 ).
10.5.5 Clean Development Mechanism/Joint Implementation
Because lack of financing is a major impediment to improved waste and wastewater management in EIT and developing countries, the JI and CDM have been useful mechanisms for obtaining external investment from industrialized countries. As described in Section 10.3 , open dumping and burning are common waste disposal methods in many developing countries, where GHG emissions occur concurrently with odours, public health and safety problems, and environmental degradation. In addition, developing countries often do not have existing infrastructure for collection and treatment of municipal wastewaters. Thus, the benefits from JI and CDM are twofold: improving waste management practices and reducing GHG emissions. To date, CDM has assisted many landfill gas recovery projects (see Box 10.2) while improving landfill operations, because adequate cover materials are required to minimize air intrusion during gas extraction (to prevent internal landfill fires). The validation of CDM projects requires attention to baselines, additionality and other criteria contained in approved methodologies ( (Hiramatsu et al., 2003 ) ); however, for landfill gas CDM projects, certified emission reductions (CERs, with units of tCO2-eq) are determined directly from quantification of the CH4 captured and combusted. In many countries, the anaerobic digestion of wastewaters and sludges could produce a useful biogas for heating use or onsite electrical generation (Government of Japan, 1997; Government of Republic of Poland, 2001 ); such projects could also be suitable for JI and CDM. In the future, waste sector projects involving municipal wastewater treatment, carbon storage in landfills or compost, and avoided GHG emissions due to recycling, composting, or incineration could potentially be implemented pending the development of approved methodologies.
Box 10.2: Significant role of landfill gas recovery for CDM projects: overview and example
As of late October 2006, 376 CDM projects had achieved registration. These include 33 landfill gas projects, which collectively total 12% of the annual average CERs (12 million of approximately 91 million CERs per year). (http://cdm.unfccc.int/Projects/registered.html). The pie chart shows the distribution of landfill gas CERs by country. Most of these projects are located in Latin America and the Carribean region (72% of landfill gas CERs), dominated by Brazil (nine projects; 48% of CERs). Some projects are flaring gas, while others are using the gas for on-site electrical generation or direct-use projects (including leachate evaporation). Although eventual landfill gas utilization is desirable, an initial flaring project under CDM can simplify the CDM process (fewer participants, lower capital cost) and permit definition of composite gas quantity and quality prior to capital investment in engines or other utilization hardware.
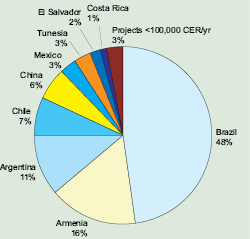
Figure 10.9: Distribution of landfill gas CDM projects based on average annual CERs for registered projects late October 2006 (unfccc.org). Includes 10.9 Mt CERs for landfill CH4 of 91 Mt total CERs. Projects <100,000 CERs/yr are located in Israel, Bolivia, Bangladesh and Malaysia
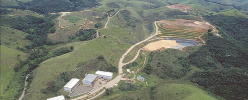
An example of a successful Brazilian project is the ONYX SASA Landfill Gas Recovery Project at the VES landfill, Trémembé, Sao Paulo State. The recovered landfill gas is flared and used to evaporate leachate. As of December, 2005, approximately 93,600 CERs had been delivered (Veolia Environmental Services, 2005 ).
10.5.6 Non-climate policies affecting GHG emissions from waste
The EIT and many developing countries have implemented market-oriented structural reforms that affect GHG emissions. As GDP is a key parameter to predict waste generation ( Daskalopoulos et al., 1998 [MoS] ), economic growth affects the consumption of materials, the production of waste, and hence GHG emissions from the waste sector. Decoupling waste generation from economic and demographic drivers, or dematerialization, is often discussed in the context of sustainable development. Many developed countries have reported recent decoupling trends ( OECD, 2002a [NPR] ), but the literature shows no absolute decline in material consumption in developed countries ( (Bringezu et al., 2004 ) ). In other words, solid waste generation does not support an environmental Kuznets curve ( (Dinda, 2004 ) ), because environmental problems related to waste are not fully internalized. In Asia, Japan and China are both encouraging ‘circular economy’ or ‘sound material-cycle society’ as a new development strategy, whose core concept is the circular (closed) flow of materials and the use of raw materials and energy through multiple phases (Japan Ministry of the Environment, 2003; ( Yuan et al., 2006 ) ). This approach is expected to achieve efficient economic growth while discharging fewer pollutants.
In 2002, the Johannesburg Summit adopted the Millennium Development Goals to reduce the number of people without access to sanitation services by 50% via the financial, technical and capacity-building expertise of the international community. If achieved, the Johannesburg Summit goals would significantly reduce GHG emissions from wastewater.
10.5.7 Co-benefits of GHG mitigation policies
Most policies and measures in the waste sector address broad environmental objectives, such as preventing pollution, mitigating odours, preserving open space and maintaining air, soil and water quality ( (Burnley, 2001 ) ). Thus, reductions in GHG emissions frequently occur as a co-benefit of regulations and policies not undertaken primarily for the purpose of climate-change mitigation (Austrian Federal Government,). Thus, reductions in GHG emissions frequently occur as a co-benefit of regulations and policies not undertaken primarily for the purpose of climate-change mitigation (Austrian Federal Government,). For example, the EU Landfill Directive is primarily concerned with preventing pollution of water, soil and air ( (Burnley, 2001 ) ).
10.6 Long-term considerations and sustainable development
10.6.1 Municipal solid waste management
GHG emissions from waste can be effectively mitigated by current technologies. Many existing technologies are also cost effective; for example, landfill gas recovery for energy use can be profitable in many developed countries. However, in developing countries, a major barrier to the diffusion of technologies is lack of capital – thus the CDM, which is increasingly being implemented for landfill gas recovery projects, provides a major incentive for both improved waste management and GHG emission reductions. For the long term, more profound changes in waste management strategy are expected in both developed and developing countries, including more emphasis on waste minimization, recycling, re-use and energy recovery. Huhtala 1997 [MoS] ) studied optimal recycling rates for municipal solid waste using a model that included recycling costs and consumer preferences; results suggested that a recycling rate of 50% was achievable, economically justified and environmentally preferable. This rate has already been achieved in many countries for the more valuable waste fractions such as metals and paper ( OECD, 2002b [NPR] ).
Decisions for alternative waste management strategies are often made locally; however, there are also regional drivers based on national regulatory and policy decisions. Selected waste management options also determine GHG mitigation options. For the many countries which continue to rely on landfilling, increased utilization of landfill CH4 can provide a cost-effective mitigation strategy. The combination of gas utilization for energy with biocover landfill cover designs to increase CH4 oxidation can largely mitigate site-specific CH4 emissions ( Huber-Humer, 2004 [NPR] ;( Barlaz et al., 2004 ) ). These technologies are simple (‘low technology’) and can be readily deployed at any site. Moreover, R&D to improve gas-collection efficiency, design biogas engines and turbines with higher efficiency, and develop more cost-effective gas purification technologies are underway. These improvements will be largely incremental but will increase options, decrease costs, and remove existing barriers for expanded applications of these technologies.
Advances in waste-to-energy have benefited from general advances in biomass combustion; thus the more advanced technologies such as fluidized bed combustion with emissions control can provide significant future mitigation potential for the waste sector. When the fossil fuel offset is also taken into account, the positive impact on GHG reduction can be even greater (e.g., Lohiniva et al. 2002 [NPR] ; Pipatti and Savolainen 1996 [SRC] ; Consonni et al. 2005 [MoS] ). High cost, however, is a major barrier to the increased implementation of waste-to-energy. Incineration has often proven to be unsustainable in developing countries – thus thermal processes are expected to be primarily (but not exclusively) deployed in developed countries. Advanced combustion technologies are expected to become more competitive as energy prices increase and renewable energy sources gain larger market share.
Anaerobic digestion as part of MBT, or as a stand-alone process for either wastewater or selected wastes (high moisture), is expected to continue in the future as part of the mix of mature waste management technologies. In general, anaerobic digestion technologies incur lower capital costs than incineration; however, in terms of national GHG mitigation potential and energy offsets, their potential is more limited than landfill CH4 recovery and incineration. When compared to composting, anaerobic digestion has advantages with respect to energy benefits (biogas), reduced process times and reduced volume of residuals; however, as applied in developed countries, it typically incurs higher capital costs. Projects where mixed municipal waste was anaerobically digested (e.g., the Valorga project) have been largely discontinued in favour of projects using specific biodegradable fractions such as food waste. In some developing countries such as China and India, small-scale digestion of biowaste streams with CH4 recovery and use has been successfully deployed for decades as an inexpensive local waste-to-energy strategy – many other countries could also benefit from similar small-scale projects. For both as a primary wastewater treatment process or for secondary treatment of sludges from aerobic processes, anaerobic digestion under higher temperature using thermophilic regimes or two-stage processes can provide shorter retention times with higher rates of biogas production.
Regarding the future of up-front recycling and separation technologies, it is expected that wider implementation of incrementally-improving technologies will provide more rigorous process control for recycled waste streams transported to secondary markets or secondary processes, including paper and aluminium recycling, composting and incineration. If analysed within an LCA perspective, waste can be considered a resource, and these improvements should result in more advantageous material and energy balances for both individual components and urban waste streams as a whole. For developing countries, provided sufficient measures are in place to protect workers and the local environment, more labour-intensive recycling practices can be introduced and sustained to conserve materials, gain energy benefits and reduce GHG emissions. In general, existing studies on the mitigation potential for recycling yield variable results because of the differing assumptions and methodologies applied; however, recent studies (i.e., Myllymaa et al., 2005 [NPR] ) are beginning to quantitatively examine the environmental benefits of alternative waste strategies, including recycling.
10.6.2 Wastewater management
Although current GHG emissions from wastewater are lower than emissions from waste, it is recognized that there are substantial emissions which are not quantified by current estimates, especially from septic tanks, latrines and uncontrolled discharges in developing countries. Nevertheless, the quantity of wastewater collected and treated is increasing in many countries in order to maintain and improve potable water quality, as well for other public health and environmental protection benefits. Concurrently, GHG emissions from wastewater will decrease relative to future increases in wastewater collection and treatment.
For developing countries, it is a significant challenge to develop and implement innovative, low-cost but effective and sustainable measures to achieve a basic level of improved sanitation ( (Moe and Reingans, 2006 ) ). Historically, sanitation in developed countries has included costly centralized sewerage and wastewater treatment plants, which do not offer appropriate sustainable solutions for either rural areas in developing countries with low population density or unplanned, rapidly growing, peri-urban areas with high population density ( Montgomery and Elimelech, 2007 [2007] ). It has been demonstrated that a combination of low-cost technology with concentrated efforts for community acceptance, participation and management can successfully expand sanitation coverage; for example, in India more than one million pit latrines have been built and maintained since 1970 ( Lenton et al., 2005 [NPR] ). The combination of household water treatment and ‘point-of-use’ low-technology improved sanitation in the form of pit latrines or septic systems has been shown to lower diarrhoeal diseases by >30% ( (Fewtrell et al., 2005 ) ).
Wastewater is also a secondary water resource in countries with water shortages. Future trends in wastewater technology include buildings where black water and grey water are separated, recycling the former for fertilizer and the latter for toilets. In addition, low-water use toilets (3–5 L) and ecological sanitation approaches (including ecological toilets), where nutrients are safely recycled into productive agriculture and the environment, are being used in Mexico, Zimbabwe, China, and Sweden ( (Esrey et al., 2003 ) ). These could also be applied in many developing and developed countries, especially where there are water shortages, irregular water supplies, or where additional measures for conservation of water resources are needed. All of these measures also encourage smaller wastewater treatment plants with reduced nutrient loads and proportionally lower GHG emissions.
10.6.3 Adaptation, mitigation and sustainable development in the waste sector
In addition to providing mitigation of GHG emissions, improved public health, and environmental benefits, solid waste and wastewater technologies confer significant co-benefits for adaptation, mitigation and sustainable development ( Table 10.7 ; see also Section 12.3.4 ). In developing countries, improved waste and wastewater management using low- or medium-technology strategies are recommended to provide significant GHG mitigation and public health benefits at lower cost. Some of these strategies include small-scale wastewater management such as septic tanks and recycling of grey water, construction of medium-technology landfills with controlled waste placement and use of daily cover (perhaps including a final biocover to optimize CH4 oxidation), and controlled composting of organic waste.
The major impediment in developing countries is the lack of capital, which jeopardizes improvements in waste and wastewater management. Developing countries may also lack access to advanced technologies. However, technologies must be sustainable in the long term, and there are many examples of advanced, but unsustainable, technologies for waste management that have been implemented in developing countries. Therefore, the selection of truly sustainable waste and wastewater strategies is very important for both the mitigation of GHG emissions and for improved urban infrastructure.
Table 10.7: Summary of adaptation, mitigation and sustainable development issues for the waste sector.
| Technologies and practices | Vulnerability to climate change | Adaptation implications & strategies to minimize emissions | Sustainable development dimensions | Comments | ||
|---|---|---|---|---|---|---|
| Social | Economic | Environmental | ||||
|
Recycling, reuse & waste minimization |
Indirect low vulnerability or no vulnerability |
Minimal implications |
Usually positive
Negative for waste scavenging without public health or safety controls |
Positive
Job creation |
Positive
Negative for waste scavenging from open dumpsites with air and water pollution |
Indirect benefits for reducing GHG emissions from waste
Reduces use of energy and raw materials. Requires implementation of health and safety provisions for workers |
|
Controlled landfilling with landfill gas recovery and utilization |
Indirect low vulnerability or positive effects: Higher temperatures increase rates of microbial methane oxidation rates in cover materials |
Minimal implications
May be regulatory mandates or economic incentives
Replaces fossil fuels for process heat or electrical generation |
Positive
Odour reduction (non-CH4 gases) |
Positive
Job creation
Energy recovery potential |
Positive
Negative for improperly managed sites with air and water pollution |
Primary control on landfill CH4 emissions with >1200 commercial projects
Important local source of renewable energy: replaces fossil fuels
Landfill gas projects comprise 12% of annual registered CERs under CDMa
Oxidation of CH4 and NMVOCs in cover soils is a smaller secondary control on emissions |
|
Controlled landfilling without landfill gas recovery |
Indirect low vulnerability or positive effects: Higher temperatures increase rates of microbial methane oxidation rates in cover materials |
Minimal implications
Gas monitoring and control still required |
Positive
Odour reduction (non-CH4 gases) |
Positive
Job creation |
Positive
Negative for improperly managed sites with air and water pollution |
Use of cover soils and oxidation in cover soils reduce rate of CH4 and NMVOC emissions |
|
Optimizing microbial methane oxidation in landfill cover soils (‘biocovers’) |
Indirect low vulnerability or positive effects: Increased rates at higher temperatures |
Minimal implications or positive effects |
Positive
Odour reduction (non-CH4 gases) |
Positive
Job creation |
Positive
Negative for improperly designed or managed biocovers with GHG emissions and NMVOC emissions |
Important secondary control on landfill CH4 emissions and emissions of NMVOCs
Utilizes other secondary materials (compost, composted sludges)
Low-cost low-technology strategy for developing countries |
|
Uncontrolled disposal (open dumping & burning) |
Highly vulnerable
Detrimental effects: warmer temp. promote pathogen growth and disease vectors |
Exacerbates adaptation problems
Recommend implementation of more controlled disposal and recycling practices |
Negative |
Negative |
Negative |
Consider alternative lower-cost medium technology solutions (e.g., landfill with controlled waste placement, compaction, and daily cover materials) |
|
Thermal processes including incineration, industrial co-combustion, and more advanced processes for waste-to-energy (e.g., fluidized bed technology with advanced flue gas cleaning) |
Low vulnerability |
Minimal implications
Requires source control and emission controls to prevent emissions of heavy metals, acid gases, dioxins and other air toxics |
Positive
Odour reduction (non-CH4 gases) |
Positive
Job creation
Energy recovery potential |
Positive
Negative for improperly designed or managed facilities without air pollution controls |
Reduces GHG emissions relative to landfilling
Costly, but can provide significant mitigation potential for the waste sector, especially in the short term
Replaces fossil fuels |
|
Aerobic biological treatment (composting)
Also a component of mechanical biological treatment (MBT) |
Indirect low vulnerability or positive effects: Higher temperatures increase rates of biological processes (Q10) |
Minimal implications or positive effects
Produces CO2 (biomass) and compost
Reduces volume, stabilizes organic C, and destroys pathogens |
Positive
Odour reduction (non-CH4 gases) |
Positive
Job creation
Use of compost products |
Positive
Negative for improperly designed or managed facilities with odours, air and water pollution |
Reduces GHG emissions
Can produce useful secondary materials (compost) provided there is quality control on material inputs and operations
Can emit N2O and CH4 under reduced aeration or anaerobic conditions |
|
Anaerobic biological treatment (anaerobic digestion)
Also a component of mechanical-biological treatment (MBT) |
Indirect low vulnerability or positive effects: Higher temperatures increase rates of biological processes |
Minimal implications
Produces CH4, CO2, and biosolids under highly controlled conditions
Biosolids require management |
Positive
Odour reduction (non-CH4 gases) |
Positive
Job creation
Energy recovery potential
Use of residual biosolids |
Positive
Negative for improperly designed or managed facilities with, odours, air and water pollution |
Reduces GHG emissions
CH4 in biogas can replace fossil fuels for process heat or electrical generation
Can emit minor quantities of CH4 during start-ups, shutdowns and malfunctions |
|
Wastewater control and treatment (aerobic or anaerobic) |
Highly vulnerable
Detrimental effects in absence of wastewater control and treatment: Warmer temperatures promote pathogen growth and poor public health |
Large adaptation implications
High potential for reducing uncontrolled GHG emissions
Residuals (biosolids) from aerobic treatment may be anaerobically digested |
Positive
Odour reduction (non-CH4 gases) |
Positive
Job creation
Energy recovery potential from anaerobic processes
Use of sludges and other residual biosolids |
Positive
Negative for improperly designed or managed facilities with odours, air and water pollution and GHG emissions |
Wide range of available technologies to collect, treat, recycle and re-use wastewater
Wide range of costs
CH4 from anaerobic processes replaces fossil fuels for process heat or electrical generation
Need to design and operate to minimize N2O and CH4 emissions during transport and treatment |
REFERENCES
Ackerman, F., 2000: Waste Management and Climate Change. Local Environment, 5(2), pp. 223-229. Clean
Austrian Federal Government, 2001: Third National Climate Report of the Austrian Federal Government. Vienna, Austria. [NPR]
Barlaz, M., 1998: Carbon storage during biodegradation of municipal solid waste components in laboratory-scale landfills. Global Biogeochemical Cycles, 12(2), pp. 373-380. [JoC]
Barlaz, M., R. Green, J. Chanton, R.D. Goldsmith, and G. Hater, 2004: Evaluation of a biologically-active cover for mitigation of landfill gas emissions. Environmental Science and Technology, 38(18), pp. 4891-4899. Clean
Bates, J. and A. Haworth, 2001: Economic evaluation of emission reductions of methane in the waste sector in the EU: Bottom-up analysis. Final Report to DG Environment, European Commission by Ecofys Energy and Environment, by AEA Technology Environment and National Technical University of Athens as part of Economic Evaluation of Sectoral Emission Reduction Objective for Climate Change, 73 pp. [NPR]
Beck-Friis, B.G. 2001: Emissions of ammonia, N2O, and CH4 during composting of organic household waste. PhD Thesis, Swedish University of Agricultural Sciences, Uppsala, 331 pp. [NPR]
Berge, N., D. Reinhart, and T. Townsend, 2005: A review of the fate of nitrogen in bioreactor landfills. Critical Reviews in Environmental Science and Technology, 35(4), pp. 365-399. Clean
Bernache-Perez, G., S. Sánchez-Colón, A.M. Garmendia, A. Dávila-Villarreal, and M.E. Sánchez-Salazar, 2001: Solid waste characterization study in Guadalajara Metropolitan Zone, Mexico. Waste Management & Research, 19, pp. 413-424. Clean
Bingemer, H.G. and P.J. Crutzen, 1987: The production of CH4 from solid wastes. Journal of Geophysical Research, 92(D2), pp. 2182-2187. [JoC]
Binner, E., 2002: The impact of mechanical-biological pretreatment on the landfill behaviour of solid wastes. Proceedings of the workshop on Biowaste, Brussels, April 8-10, 2002. pp. 16. [NPR]
Bockreis, B. and I. Steinberg, 2005: Influence of mechanical-biological waste pre-treatment methods on gas formation in landfills. Waste Management, 25, pp. 337-343. Clean
Bogner, J., 1992: Anaerobic burial of refuse in landfills: increased atmospheric methane and implications for increased carbon storage. Ecological Bulletin, 42, pp. 98-108. [SRC]
Bogner, J. and E. Matthews, 2003: Global methane emissions from landfills: New methodology and annual estimates 1980-1996. Global Biogeochemical Cycles, 17, pp. 34-1 to 34-18. [JoC, MoS, SRC]
Bogner, J., M. Meadows, and P. Czepiel, 1997a: Fluxes of methane between landfills and the atmosphere: natural and engineered controls. Soil Use and Management, 13, pp. 268-277. [SRC]
Bogner, J., C. Scheutz, J. Chanton, D. Blake, M. Morcet, C. Aran, and P. Kjeldsen, 2003: Field measurement of non-methane organic compound emissions from landfill cover soils. Proceedings of the Sardinia ‘03, International Solid and Hazardous Waste Symposium, published by CISA, University of Cagliari, Sardinia. [NPR, SRC]
Bogner, J. and K. Spokas, 1993: Landfill CH4: rates, fates, and role in global carbon cycle. Chemosphere, 26(1-4), pp. 366-386. [SRC]
Bogner, J., K. Spokas, and E. Burton, 1997b: Kinetics of methane oxidation in landfill cover materials: major controls, a whole-landfill oxidation experiment, and modeling of net methane emissions. Environmental Science and Technology, 31, pp. 2504-2614. [MoS, SRC]
Bogner, J., K. Spokas, and E. Burton, 1999a: Temporal variations in greenhouse gas emissions at a midlatitude landfill. Journal of Environmental Quality, 28, pp. 278-288. [SRC]
Bogner, J., K. Spokas, E. Burton, R. Sweeney, and V. Corona, 1995: Landfills as atmospheric methane sources and sinks. Chemosphere, 31(9), pp. 4119-4130. [SRC]
Bogner, J., K. Spokas, J. Chanton, D. Powelson, and T. Abichou, 2005: Modeling landfill methane emissions from biocovers: a combined theoretical-empirical approach. Proceedings of the Sardinia ‘05, International Solid and Hazardous Waste Symposium, published by CISA, University of Cagliari, Sardinia. [NPR, MoS, SRC]
Borjesson, G., 1996: Methane oxidation in landfill cover soils. Doctoral Thesis, Dept. of Microbiology, Swedish University of Agricultural Sciences, Uppsala, Sweden. [NPR]
Borjesson, G. and B. Svensson, 1997a: Nitrous oxide release from covering soil layers of landfills in Sweden. Tellus, 49B, pp. 357-363. Clean
Borjesson, G. and B. Svensson, 1997b: Seasonal and diurnal methane emissions from a landfill and their regulation by methane oxidation. Waste Management and Research, 15(1), pp. 33-54. Clean
Bramryd, T., 1997: Landfilling in the perspective of the global CO2 balance. Proceedings of the Sardinia ‘97, International Landfill Symposium, October 1997, published by CISA, University of Cagliari, Sardinia. [NPR]
Bringezu, S., H. Schutz, S. Steger, and J. Baudisch, 2004: International comparison of resource use and its relation to economic growth: the development of total material requirement, direct material inputs and hidden flows and the structure of TMR. Ecological Economics, 51, pp. 97-124. Clean
Burnley, S., 2001: The impact of the European landfill directive on waste management in the United Kingdom. Resources, Conservation and Recycling, 32, pp. 349-358. Clean
CALEB, 2000: Development of a global emission function for blowing agents used in closed cell foam. Final report prepared for AFEAS. Caleb Management Services, Bristol, United Kingdom. [NPR]
CalRecovery, Inc., 2004: Waste analysis and characterization study. Asian Development Bank, Report TA - 3848-PHI. [NPR]
CalRecovery, Inc., 2005: Solid waste management. Report to Division of Technology, Industry, and Economics, International Environmental Technology Centre, UNEP, Japan, Vols. 1 and 2. <www.unep.or.jp/Ietc/Publications/spc/Solid_Waste_Management/index.asp>, accessed 13/08/07. [NPR]
CEPI, 2003: Summary of the study on non-collectable and non-recyclable paper products. Confederation of European Paper Industries (CEPI), Brussels, Belgium. [NPR]
Chanton, J. and K. Liptay, 2000: Seasonal variation in methane oxidation in a landfill cover soil as determined by an in situ stable isotope technique. Global Biogeochemical Cycles, 14, pp. 51-60. [JoC]
Chen, L., M. Nanny, D. Knappe, T. Wagner, and N. Ratasuk, 2004: Chemical characterization and sorption capacity measurements of degraded newsprint from a landfill. Environmental Science and Technology, 38, pp. 3542-3550. Clean
Christensen, T., 1989: Environmental aspects of sanitary landfilling. In Sanitary Landfilling, T. Christensen, et al., (ed.), Academic Press, San Diego, pp. 19-29. [NPR]
Cointreau, S., 2001: Declaration of principles for sustainable and integrated solid waste management, World Bank, Washington, D.C., 4 pp. [NPR]
Cointreau-Levine, S., 1994: Private sector participation in municipal solid waste services in developing countries, Vol.1, The Formal Sector. Urban Management and the Environment, 13, UNDP/UNCHS (United Nations Centre for Human Settlements), World Bank, Washington, D.C., 52 pp. Clean
Coleman, D.D., 1979: The origin of drift-gas deposits as determined by radiocarbon dating of methane. In Radiocarbon Dating, R. Berger and H.E. Seuss (eds), University of California Press, Berkeley, pp. 365-387. [NPR]
Commission of the European Community, 2001: Third Communication from the European Community under the UN Framework Convention on Climate Change, Brussels. [NPR]
Consonni, S., M. Giugliano, and M. Grosso, 2005: Alternative strategies for energy recovery from municipal solid waste. Part B: emission and cost estimates. Waste Management, 25, pp. 137-148. [MoS]
Czepiel, P., B. Mosher, R. Harriss, J.H. Shorter, J.B. McManus, C.E. Kolb, E. Allwine, and B. Lamb, 1996: Landfill methane emissions measured by enclosure and atmospheric tracer methods. Journal of Geophysical Research, D101, pp. 16711-16719. [JoC]
Daniel, J., G.J.M. Velders, S. Solomon, M. McFarland, and S.A. Montzka, 2007: Present and future sources and emissions of halocarbons: Toward new constraints. Journal of Geophysical Research, 112(D02301), pp. 1-11. [PoC, JoC, MoS, ARC, 2007]
Daskalopoulos, E., O. Badr, and S.D. Probert, 1998: Municipal solid waste: a prediction methodology for the generation rate and composition in the European Union countries and the United States of America, Resources. Conservation and Recycling, 24, pp. 155-166. [MoS]
De Feber, M. and D. Gielen, 2000: Biomass for greenhouse gas emission reduction. Task 7, Energy Technology Characterisation. Netherlands Energy Research Foundation, Report nr. ECN-C--99-078. [NPR, ARC]
De Jager, D. and K. Blok, 1996: Cost-effectiveness of emission-reduction measures for CH4 in the Netherlands. Energy Conservation Management, 37, pp. 1181-1186. [ARC]
De Visscher, A., D. Thomas, P. Boeckx, and O. Van Cleemput, 1999: Methane oxidation in simulated landfill cover soil environments. Environmental Science and Technology, 33(11), pp. 1854-1859. [MoS]
De Visscher, A., I. De Pourcq, and J. Chanton, 2004: Isotope fractionation effects by diffusion and methane oxidation in landfill cover soils. Journal of Geophysical Research, 109 (D18), paper D18111. [JoC]
Delhotal, C., F. de la Chesnaye, A. Gardiner, J. Bates, and A. Sankovski, 2006: Estimating potential reductions of methane and nitrous oxide emissions from waste, energy and industry. The Energy Journal. Special Issue: Multi-Greenhouse Gas Mitigation and Climate Policy, F.C. de la Chesnaye and J. Weyant (eds). [NPR, MoS, ARC]
DESA/UN, 2005: Country, regional and global estimates on water and sanitation, statistics division. Dept. of Economic and Social Affairs/UN, MDG Report - WHO/UNICEF WES estimate, <http://www.unicef.org/wes/mdgreport> accessed 29/06/07. [NPR, MoS]
Detzel, A., R. Vogt, H. Fehrenbach, F. Knappe, and U. Gromke, 2003: Anpassung der deutschen Methodik zur rechnerischen Emissionsermittlung und internationale Richtlinien: Teilberich Abfall/Abwasser. IFEU Institut - Öko-Institut e.V. 77 pp. [NPR]
Deuber, O., M. Cames, S. Poetzsch, and J. Repenning, 2005: Analysis of greenhouse gas emissions of European countries with regard to the impact of policies and measures. Report by Öko-Institut to the German Umweltbundesamt, Berlin, 253 pp. [NPR]
Diaz, L.F. and L.L. Eggerth, 2002: Waste Characterization Study. Ulaanbaatar, Mongolia, WHO/WPRO, Manila, Philippines. [NPR, SRC]
Diaz, L.F., G. Savage, and C. Goluke, 2002: Solid waste composting. In Handbook of Solid Waste Management, G. Tchobanoglous and F. Kreith (eds.), McGraw-Hill, Chapter 12. [NPR, SRC]
Diaz, L.F., A. Chiumenti, G. Savage, and L. Eggerth, 2006: Managing the organic fraction of municipal solid waste. Biocycle, 47, pp. 50-53. [SRC]
Dinda, S., 2004: Environmental Kuznets curve hypothesis: a survey. Ecological Economics, 49, pp. 431-455. Clean
Dornberg, V. and A. Faaij, 2006: Optimising waste treatment systems. Part B: Analyses and scenarios for The Netherlands. Resources Conservation & Recycling, 48, pp. 227-248. [SRC]
Du, W., Q. Gao, E. Zhang, 2006a: The emission status and composition analysis of municipal solid waste in China. Journal of Research of Environmental Sciences, 19, pp. 85-90. [SRC]
Du, W., Q. Gao, E. Zhang, 2006b: The treatment and trend analysis of municipal solid waste in China. Journal of Research of Environmental Sciences, 19, pp. 115-120. [SRC]
EEA, 2004: Greenhouse gas emission trends and projections in Europe 2004. European Environment Agency (EEA) Report no5/2004, Progress EU and its member states towards achieving their Kyoto targets, Luxembourg, ISSN 1725-9177, 40 pp. [NPR, MoS]
EEA, 2005: European Environment Outlook. EU Report 4/2005, ISSN 1725-9177, Luxembourg, published by the European Environment Agency (EEA), Copenhagen, 92 pp. [NPR]
EIPPC Bureau, 2006: Reference document on the best available techniques for waste incineration (BREF), integrated pollution prevention and control. European IPPC, Seville, Spain, 602 pp. <http://eippcb.jrc.es> [NPR]
Esrey, S., I. Andersson, A. Hillers, and R. Sawyer, 2003 (2nd edition): Closing the loop - ecological sanitation for food security. Swedish International Development Agency (SIDA), Publications on Water Resources, 18, Mexico City, Mexico. Clean
EU, 1999: Council Directive 1999/31/3C of 26 April 1999 on the landfill of waste. Official Journal of the European Communities 16.7.1999. [NPR]
Eurostat, 2003: Waste generated and treated in Europe. Data 1990-2001. Office for Official Publications of the European Communities, Luxemburg, 140 pp. [NPR]
Faaij, A., M. Hekkert., E. Worrell, and A. van Wijk, 1998: Optimization of the final waste treatment system in the Netherlands. Resources, Conservation, and Recycling, 22, pp. 47-82. [SRC]
Fewtrell, L., R. Kaufmann, D. Kay, W. Enanoria, L. Haller, and J. Colford, 2005: Water, sanitation, and hygiene interventions to reduce diarrhoea in less developed countries: a systematic review and meta-analysis. Lancet, 5, pp. 42-52. Clean
Flugsrud, K., B. Hoem, E. Kvingedal, and K. Rypdal, 2001: Estimating net emissions of CO2 from harvested wood products. SFT report 1831/200, Norwegian Pollution Control Authority, Oslo, 47 pp. <http://www.sft.no/publikasjoner/luft/1831/ta1831.pdf>, accessed 29/06/07. [NPR, MoS, ARC]
Fredenslund, A.M., C. Scheutz, and P. Kjeldsen, 2005: Disposal of refrigerators-freezers in the U.S.: State of Practice. Report by Environment and Resources. Technical University of Denmark (DTU). Lyngby. [NPR, SRC]
Fullerton, D. and T.C. Kinnaman, 1996: Household responses to pricing garbage by the bag. American Economic Review, 86 (4), pp. 971-984. Clean
Galle, B., J. Samuelsson, B. Svensson, and G. Borjesson, 2001: Measurements of methane emissions from landfills using a time correlation tracer method based on FTIR absorption spectroscopy. Environmental Science and Technology, 35(1), pp. 21-25. Clean
Gamlen, P.H., B.C. Lane, and P.M. Midgley, 1986: The production and release to the atmosphere of CCl3F and CCl2F2 (Chlorofluorocarbons CFC-11 and CFC-12). Atmospheric Environment, 20(6), pp. 1077-1085. Clean
Gebert, J. and A. Gröngröft, 2006: Passive landfill gas emission - influence of atmospheric pressure and implications for the operation of methane-oxidising biofilters. Waste Management, 26, pp. 245-251. Clean
Giegrich, J. and R. Vogt, 2005: The contribution of waste management to sustainable development in Germany. Umweltbundesamt Report FKZ 203 92 309, Berlin. [NPR]
Government of Japan, 1997: Japan’s Second National Communication to the UNFCCC, Tokyo. [NPR]
Government of Japan, 2002: Japan’s Third National Communication to the UNFCCC, Tokyo. [NPR]
Government of Norway, 2002: Norway’s Third National Communication to the UNFCCC, Oslo. [NPR]
Government of Republic of Poland, 2001: Third National Communication to the COP of the UNFCCC, Warsaw. [NPR]
Government of the Netherlands, 2001: Third Netherlands National Communication on Climate Change Policies, The Hague. [NPR]
Griffiths, A.J. and K.P. Williams, 2005: Thermal treatment options. Waste Management World, July-August 2005. [NPR]
Grigg, S.V.L. and A.D. Read, 2001: A discussion on the various methods of application for landfill tax credit funding for environmental and community projects. Resources, Conservation and Recycling, 32, pp. 389-409. Clean
Hanisch, C., 2000: Is extended producer responsibility effective? Environmental Science and Technology, 34(7), pp. 170A-175A. Clean
Hashimoto, S. and Y. Moriguchi, 2004: Data book: material and carbon flow of harvested wood in Japan. CGER Report D034, National Institute for Environmental Studies, Japan, Tsukuba. 40 pp. <http://www-cger.nies.go.jp/> accessed 29/06/07. [NPR, SRC]
Haury, E.W., 1976: The Hohokam: Desert Farmers and Craftsmen, University of Arizona Press, Tucson, Arizona. [NPR]
Hellebrand, H.J., 1998: Emissions of N2O and other trace gases during composting of grass and green waste. Journal of Agricultural Engineering Research, 69, pp. 365-375. Clean
Hiramatsu, A., K. Hanaki, and T. Aramaki, 2003: Baseline options and greenhouse gas emission reduction of clean development mechanism project in urban solid waste management. Mitigation and Adaptation Strategies for Global Change, 8, pp. 293-310. Clean
Ho, G., 2000: Proceedings of the Regional Workshop on sustainable wastewater and stormwater management in Latin America and the Caribbean. 27-31 March 2000, International Environmental Technology Centre, Report Series - Issue 10, United Nations, Osaka, Shiga, pp. 115-156. [NPR]
Hobson, A., J. Frederickson, and N. Dise, 2005: CH4 and N2O from mechanically turned windrow and vermicomposting systems following in-vessel pre-treatment. Waste Management, 25, pp. 345-352. Clean
Hoornweg, D., 1999: What a waste: solid waste management in Asia. Report of Urban Development Sector Unit, East Asia and Pacific Region, World Bank, Washington, D.C. [NPR]
Hoornweg, D., L. Thomas, and L. Otten, 1999: Composting and its applicability in developing countries. Urban Waste Management Working Paper 8, Urban Development Division, World Bank, Washington, DC. 46 pp. [NPR]
Hovde, D.C., A.C. Stanton, T.P. Meyers, and D.R. Matt, 1995: Methane emissions from a landfill measured by eddy correlation using a fast-response diode laser sensor. Journal of Atmospheric Chemistry, 20, pp. 141-162. Clean
Huang, Q., Q. Wang, L. Dong, B. Xi, and B. Zhou, 2006: The current situation of solid waste management in China. The Journal of Material Cycles and Waste Management, 8, pp. 63-69. Clean
Huber-Humer, M., 2004: Abatement of landfill methane emissions by microbial oxidation in biocovers made of compost. PhD Thesis, University of Natural Resources and Applied Life Sciences (BOKU), Vienna, 279 pp. [NPR]
Huhtala, A., 1997: A post-consumer waste management model for determining optimal levels of recycling and landfilling. Environmental and Resource Economics, 10, pp. 301-314. [MoS]
Idris, A., et al., 2003: Overview of municipal solid waste landfill sites in Malaysia. Proceedings of the 2nd Workshop on Material Cycles and Waste Management in Asia, Tsukuba, Japan. [NPR]
IPCC, 1996: Greenhouse gas inventory reference manual: Revised 1996 IPCC guidelines for national greenhouse gas inventories, Reference manual Vol. 3, J.T. Houghton, L.G. Meira Filho, B. Lim, K. Treanton, I. Mamaty, Y. Bonduki, D.J. Griggs and B.A. Callender [Eds]. IPCC/OECD/IEA. UK Meteorological Office, Bracknell, pp. 6.15-6.23. [NPR]
IPCC, 2000: Emissions Scenarios [Nakicenovic, N., and R. Swart (eds.)]. Special Report of the Intergovernmental Panel on Climate Change (IPCC). Cambridge University Press, Cambridge, 570 pp. [NPR]
IPCC, 2001a: Climate Change 2001: Mitigation. Contribution of Working Group III to the third assessment report of the Intergovernmental Panel on Climate Change (IPCC). Cambridge University Press, Cambridge. [NPR]
IPCC, 2001b: Climate Change 2001: The Scientific Basis. Contribution of Working Group I to the third assessment report of the Intergovernmental Panel on Climate Change (IPCC). Cambridge University Press, Cambridge. [NPR]
IPCC, 2005: Safeguarding the Ozone Layer and the Global Climate System: issues related to Hydrofluorocarbons and Perfluorocarbons. Special Report of the Intergovernmental Panel on Climate Change (IPCC). Cambridge University Press, Cambridge. [NPR]
IPCC, 2006: IPCC Guidelines for National Greenhouse Gas Inventories. IPCC/IGES, Hayama, Japan. http://www.ipcc-nggip.iges.or.jp/public/2006gl/ppd.htm [NPR]
Iskandar, L., 2001: The informal solid waste sector in Egypt: prospects for formalization, published by Community and Institutional Development, Cairo, Egypt, 65 pp. [NPR]
Japan Ministry of the Environment, 2003: Fundamental plan for establishing a sound material-cycle society. <http://www.env.go.jp/en/recycle/smcs/f_plan.pdf> accessed 25/06/07. [NPR]
Japan Ministry of the Environment, 2006: State of discharge and treatment of municipal solid waste in FY 2004. [NPR]
Jenkins, R.R., S.A. Martinez, K. Palmer, and M.J. Podolsky, 2003: The determinants of household recycling: a material-specific analysis of recycling program features and unit pricing. Journal of Environmental Economics and Management, 45(2), pp. 294-318. Clean
Johannessen, L.M. and G. Boyer, 1999: Observations of solid waste landfills in developing countries: Africa, Asia, and Latin America. Report by Urban Development Division, Waste Management Anchor Team, World Bank, Washington, D.C. [NPR]
Jouravlev, A., 2004: Los servicios de agua potable y saneamiento en el umbral del siglo XXI. Santiago de Chile, julio 2004, CEPAL - Serie Recursos Naturales e Infraestructura No 74. [NPR]
Kaartinen, T., 2004: Sustainable disposal of residual fractions of MSW to future landfills. M.S. Thesis, Technical University of Helsinki, Espoo, Finland. In Finnish. [NPR, MoS]
Kaseva, M.E., S.B. Mbuligwe, and G. Kassenga, 2002: Recycling inorganic domestic solid wastes: results from a pilot study in Dar es Salaam City, Tanzania. Resources Conservation and Recycling, 35, pp. 243-257. Clean
Khan, M.Z.A. and A.H. Abu-Ghararath, 1991: New approach for estimating energy content of municipal solid waste. Journal of Environmental Engineering, 117, 376-380. [MoS]
Kightley, D., D. Nedwell, and M. Cooper, 1995: Capacity for methane oxidation in landfill cover soils measured in laboratory-scale microcosms. Applied and Environmental Microbiology, 61, pp. 592-601. Clean
Kjeldsen, P. and M.H. Jensen, 2001: Release of CFC-11 from disposal of polyurethane from waste. Environmental Science and Technology, 35, pp. 3055-3063. [SRC]
Kjeldsen, P. and C. Scheutz, 2003: Short and long term releases of fluorocarbons from disposal of polyurethane foam waste. Environmental Science and Technology, 37, pp. 5071-5079. [SRC]
Kuehle-Weidemeier, M. and H. Doedens, 2003: Landfilling and properties of mechanical-biological treated municipal waste. Proceedings of the Sardinia ‘03, International Solid and Hazardous Waste Symposium, October 2005, published by CISA, University of Cagliari, Sardinia. [NPR]
Lenton, R., A.M. Wright, and K. Lewis, 2005: Health, dignity, and development: what will it take? UN Millennium Project Task Force on Water and Sanitation, published by Earthscan, London. [NPR]
Lohiniva, E., K. Sipilä, T. Mäkinen, and L. Hietanen, 2002: Waste-to-energy and greenhouse gas emissions. Espoo, VTT - Tiedotteita - Research Notes 2139, 119 pp. In Finnish (published in English in 2006). [NPR]
Mertins, L., C. Vinolas, A. Bargallo, G. Sommer, and J. Renau, 1999: Development and application of waste factors - An overview. Technical Report No. 37, European Environment Agency, Copenhagen. [NPR]
Micales, J.A. and K.E. Skog, 1997: The decomposition of forest products in landfills. International Biodeterioration and Biodegradation, 39(2-3), pp. 145-158. Clean
Miranda, M.L., S.D. Bauer, and J.E. Aldy, 1996: Unit pricing programs for residential municipal solid waste: an assessment of the literatures. Report prepared for U.S. Environmental Protection Agency, Washington D.C. [NPR]
Miranda, M.L., J.W. Everett, D. Blume, and B.A. Roy, 1994: Market-based incentives and residential municipal solid waste. Journal of Policy Analysis and Management, 13(4), pp. 681-698. Clean
Moe, C.L., and R.D. Reingans, 2006: Global challenges in water, sanitation, and health. Journal Water Health, 4, pp. 41-57. Clean
Monni, S., R. Pipatti, A. Lehtilä, I. Savolainen, and S. Syri, 2006: Global climate change mitigation scenarios for solid waste management. Espoo, Technical Research Centre of Finland. VTT Publications, No. 603, pp 51. [NPR, SRC]
Montgomery, M.A. and M. Elimelech, 2007: Water and sanitation in developing countries: including health in the equation. Environmental Science and Technology, 41, pp. 16-24. [2007]
Morris, J.R., P.S. Phillips, and A.D. Read, 2000: The UK landfill tax: financial implications for local authorities. Public Money and Management, 20(3), pp. 51-54. Clean
Morris, J.R., 2001: Effects of waste composition on landfill processes under semi-arid conditions. PhD Thesis, Faculty of Engineering, University of the Witwatersrand, Johannesburg, S. Africa. 1052 pp. [NPR]
Mosher, B., P. Czepiel, R. Harriss, J. Shorter, C. Kolb, J.B. McManus, E. Allwine, and B. Lamb, 1999: Methane emissions at nine landfill sites in the northeastern United States. Environmental Science and Technology, 33(12), pp. 2088-2094. Clean
Myllymaa, T., H. Dahlbo, M. Ollikainen, S. Peltola and M. Melanen, 2005: A method for implementing life cycle surveys of waste management alternatives: environmental and cost effects. Helsinki, Suomen Ympäristö - Finnish Environment 750, 108 pp. [NPR]
National Bureau of Statistics of China, 2006: China Statistical Yearbook 2005/2006, China Statistics Press, Beijing. [NPR]
Nozhevnikova, A.N., A.B. Lifshitz, V.S. Lebedev, and G.A. Zavarin, 1993: Emissions of methane into the atmosphere from landfills in the former USSR. Chemosphere, 26(1-4), pp. 401-417. Clean
OECD, 2001: Extended producer responsibility: A guidance manual for governments. OECD publishers, Paris. [NPR]
OECD, 2002a: Indicators to measure decoupling of environmental pressure from economic growth. OECD Environment Directorate. SG/SD(2002)1/FINAL, 108 pp. [NPR]
OECD, 2002b: Environmental data waste compendium 2002. Environmental Performance and Information Division, OECD Environment Directorate. Working Group on Environmental Information and Outlooks. 27 pp. [NPR]
OECD, 2003: OECD Environmental Data Compendium 2002. Paris. <www.oecd.org> accessed 25/06/07. [NPR]
OECD, 2004: Towards waste prevention performance indicators. OECD Environment Directorate. Working Group on Waste Prevention and Recycling and Working Group on Environmental Information and Outlooks. 197 pp. [NPR]
Ojeda-Benitez, S., and J.L. Beraud-Lozano, 2003: Characterization and quantification of household solid wastes in a Mexican city. Resources, Conservation and Recycling, 39(3), pp. 211-222. Clean
Onuma, E., Y. Izumi, and H. Muramatsu, 2004: Consideration of CO2 from alternative fuels in the cement industry. <http://arch.rivm.nl/env/int/ipcc/docs/ITDT/ITDT%20Energy%20Intensive%20Industry%20Session.pdf>, accessed 25/06/07. [NPR]
Oonk, H. and T. Boom, 1995: Landfill gas formation, recovery and emissions. TNO-report 95-130, TNO, Apeldoorn, the Netherlands. [NPR]
Perla, M., 1997: Community composting in developing countries. Biocycle, June, pp. 48-51. [NPR]
Petersen, S.O., A.M. Lind, and S.G. Sommer, 1998: Nitrogen and organic matter losses during storage of cattle and pig manure. Journal of Agricultural Science, 130, pp. 69-79. Clean
Pimenteira, C.A.P., A.S. Pereira, L.B. Oliveira, L.P. Rosa, M.M. Reis, and R.M. Henriques, 2004: Energy conservation and CO2 emission reductions due to recycling in Brazil, Waste Management, 24, pp. 889-897. Clean
Pingoud, K., A-L. Perälä, S. Soimakallio, and A. Pussinen, 1996: Greenhouse impact of the Finnish forest sector including forest products and waste management. Ambio, 25, pp. 318-326. Clean
Pipatti, R. and I. Savolainen, 1996: Role of energy production in the control of greenhouse gas emissions from waste management. Energy Conservation Management, 37(6-8), pp. 1105-1110. [SRC]
Pipatti, R. and M. Wihersaari, 1998: Cost-effectiveness of alternative strategies in mitigating the greenhouse impact of waste management in three communities of different size. Mitigation and Adaption Strategies for Global Change, 2, pp. 337-358. [SRC]
PNUD/UNDP, 2005: Informe sobre desarrollo humano 2005: la cooperación internacional ante una encrucijada, Cuadro 7 - Agua, Saneamiento y Nutrición. Publicado para el Programa de las Naciones Unidas para el Desarrollo, Ediciones Mundi - Prensa 2005, Barcelona, Spain. <http://hdr.undp.org/statistics> accessed 29/06/07. [NPR]
Powelson, D., J. Chanton, and T. Abichou, 2007: Methane oxidation in biofilters measured by mass-balance and stable isotope methods. Environmental Science and Technology, 41, pp. 620-625. [2007]
Price, J.L., 2001: The landfill directive and the challenge ahead: demands and pressures on the UK householder. Resources, Conservation and Recycling, 32, pp. 333-348. Clean
Rathje, W.L., W.W. Hughes, D.C. Wilson, M.K. Tani, G.H. Archer, R.G. Hunt, and T.W. Jones, 1992: The archaeology of contemporary landfills. American Antiquity, 57(3), pp. 437-447. Clean
Reinhart, D. and T. Townsend, 1998: Landfill bioreactor design and operation. Lewis/CRC Press, Boca Raton, Florida. [NPR]
Reinhart, D., T. Townsend, and P. McCreanor, 2002: The status of bioreactor landfills. Waste Management and Research, 20, pp. 67-81. Clean
Richards, K., 1989: Landfill gas: working with Gaia. Biodeterioration Abstracts, 3(4), pp. 317-331. Clean
Rinne, J., M. Pihlatie, A. Lohila, T. Thum, M. Aurela, J-P. Tuovinen, T. Laurila, and R.Vesala, 2005: N2O emissions from a municipal landfill. Environmental Science and Technology, 39, pp. 7790-7793. Clean
Ritzkowski, M. and R. Stegmann, 2005: Reduction of GHG emissions by landfill in situ aeration. Proceedings of the Sardinia ‘05, International Solid and Hazardous Waste Symposium, October 2005, published by CISA, University of Cagliari, Sardinia. [NPR]
Savage, G., L.F. Diaz, C. Golueke, C. Martone, and R. Ham, 1998: Guidance for landfilling waste in economically developing countries. ISWA Working Group on Sanitary Landfilling, published under U.S. EPA Contract 68-C4-0022. ISBN No. 87-90402-07-3, 300 pp. [NPR, SRC]
Scharf, H., H. Oonk, A. Hensen, and D.M.M. van Rijn, 2002: Emission measurements as a tool to improve methane emission estimates. Proceedings of the Intercontinental Landfill Research Symposium, Asheville, NC. [NPR, MoS]
Scheehle, E. and M. Doorn, 2003: Improvements to the U.S. wastewater CH4 and N2O emissions estimates. Proceedings 12th International Emissions Inventory Conference, “Emissions Inventories—Applying New Technologies”, San Diego, California, April 29-May 3, 2003, published by U.S. EPA, Washington, DC., <www.epa.gov/ttn/chief/conference/ei12>, accessed 12/08/07. [NPR, MoS]
Scheehle, E., and D. Kruger, 2006: Global anthropogenic methane and nitrous oxide emissions, in Yatchew, A., ed., Multi-Greenhouse Gas Mitigation and Climate Policy, Special Issue #3 Energy Journal, 520 pp. [NPR]
Scheutz, C. and P. Kjeldsen, 2002: Determination of the fraction of blowing agent released from refrigerator/freezer foam after decommissioning the product. Report Environment and Resources, Technical University of Denmark (DTU), Lygnby, 72pp. [NPR, SRC]
Scheutz, C., J. Bogner, J. Chanton, D. Blake, M. Morcet, and P. Kjeldsen, 2003a: Comparative oxidation and net emissions of CH4 and selected non-methane organic compounds in landfill cover soils. Environmental Science and Technology, 37, pp. 5143-5149. [SRC]
Scheutz, C., A.M. Fredenslund, P. Kjeldsen, 2003b: Attennuation of alternative blowing agents in landfills. Report Environment and Resources, Technical University of Denmark (DTU), Lyngby, 66 pp. [NPR, SRC]
Silva, G., 1998: Private participation in the water and sewerage sector - recent trends. In Public Policy for the Private Sector (Viewpoint): Water. World Bank, Washington D.C., pp. 12-20. [NPR]
Simmons, P., N. Goldstein, S. Kaufman, N. Themelis, and J. Thompson, Jr., 2006: The state of garbage in America. Biocycle, 47, pp. 26-35. Clean
Smith, A., K. Brown, S. Ogilvie, K. Rushton, and J. Bates, 2001: Waste management options and climate change. Final Report ED21158R4.1 to the European Commission, DG Environment, AEA Technology, Oxfordshire, 205 pp. [NPR]
Spokas, K., J. Bogner, J. Chanton, M. Morcet, C. Aran, C. Graff, Y. Moreau-le-Golvan, N. Bureau, and I. Hebe, 2006: Methane mass balance at three landfill sites: what is the efficiency of capture by gas collection systems? Waste Management, 26, pp. 516-525. [SRC]
Statistics Finland, 2005: Environment Statistics. Environment and Natural Resources, 2, Helsinki, 208 pp. [NPR]
Stegmann, R., 2005: Mechanical biological pretreatment of municipal solid waste. Proceedings of the Sardinia ‘05, International Waste Management and Landfill Symposium, October, 2005, CISA, University of Cagliari, Sardinia. [NPR]
Streese, J., and R. Stegmann, 2005: Potentials and limitations of biofilters for methane oxidation. Proceedings of the Sardinia ‘05, International Waste Management and Landfill Symposium, October, 2005, CISA, University of Cagliari, Sardinia. [NPR]
Swedish Environmental Protection Agency, 2005: A strategy for sustainable waste management: Sweden’s Waste Plan, published by the Swedish Environmental Protection Agency, 54 pp. [NPR]
TFFEoL, 2005: Report of the UNEP task force on foam end-of-life issues. Task force on Foam End-of-Life Issues, May 2005, Montreal Protocol on Substances that Deplete the Ozone Layer. UNEP Technology and Economic Assessment Panel, 113 pp. [NPR]
Themelis, N., 2003: An overview of the global waste-to-energy industry. Waste Management World, 2003-2004 Review Issue July-August 2003, pp. 40-47. Clean
Thorneloe, S., K. Weitz, S. Nishtala, S. Yarkosky, and M. Zannes, 2002: The impact of municipal solid waste management on greenhouse gas emissions in the United States. Journal of the Air & Waste Management Association, 52, pp. 1000-1011. Clean
Thorneloe, S., K. Weitz, and J. Jambeck, 2005: Moving from solid waste disposal to materials management in the United States. Proceedings of the Sardinia ‘05, International Solid and Hazardous Waste Symposium, published by CISA, University of Cagliari, Sardinia. [NPR]
Tregoures, A., A. Beneito, P. Berne, M.A. Gonze, J.C. Sabroux, D. Savanne, Z. Pokryszka, C. Tauziede, P. Cellier, P.Laville, R. Milward, A. Arnaud, and R. Burkhalter, 1999: Comparison of seven methods for measuring methane flux at a municipal solid waste landfill site. Waste Management and Research, 17, pp. 453-458. Clean
Tsujimoto, Y., J. Masuda, J. Fukuyama, and H. Ito, 1994: N2O emissions at solid waste disposal sites in Osaka City. Air Waste, 44, pp. 1313-1314. Clean
Tuhkanen, S., R. Pipatti, K. Sipilä, and T. Mäkinen, 2001: The effect of new solid waste treatment systems on greenhouse gas emissions. In Greenhouse Gas Control Technologies. Proceeding of the Fifth International Conference on Greenhouse Gas Control Technologies (GHGT-5). D.J. Williams, R.A. Durie, P. Mcmullan, C.A.J. Paulson, and A.Y. Smith, (eds). Collingwood: CSIRO Publishing, pp. 1236-1241. [NPR, SRC]
UNEP/GPA-UNESCO/IHE, 2004: Improving municipal wastewater management in coastal cities. Training Manual, version 1, February 2004, UNEP/GPA Coordination Office, The Hague, Netherlands, pp. 49-81 and 103-117. [NPR]
UNFCCC, 2005: Key GHG Data. United Nations Framework Convention on Climate Change, <http://www.unfccc.int/resource/docs/publications/keyghg.pdf> accessed 25/06/07. [NPR]
UNFCCC/IPCC, 2004, Historical [1990] Greenhouse Gas Emissions Data. <unfccc.int/ghg_emissions_data/items/3800.php>, accessed 12/08/07. [NPR]
US EPA, 1999: National source reduction characterization report for municipal solid waste in the United States. EPA 530R-99-034, Office of Solid Waste and Emergency Response, Washington, D.C. [NPR]
US EPA, 2003: International analysis of methane and nitrous oxide abatement opportunities. Report to Energy Modeling Forum, Working Group 21. U.S. Environmental Protection Agency June, 2003. <http://www.epa.gov/methane/intlanalyses.html>. [NPR, MoS]
US EPA, 2005: Municipal solid waste generation, recycling and disposal in the United States: facts and figures for 2003. Washington, D.C., USA, <http://www.epa.gov/garbage/pubs/msw03rpt.pdf> accessed 25/06/07. [NPR]
US EPA, 2006: Global anthropogenic non-CO2 greenhouse gas emissions: 1990-2020. Office of Atmospheric Programs, Climate Change Division. <http://www.epa.gov/ngs/econ-inv/downloads/GlobalAnthroEmissionsReport.pdf> accessed 25/06/07. [NPR]
Veolia Environmental Services, 2005: Monitoring Report, Onyx SASA Landfill Gas Recovery Project, Tremembe, Brazil. Period 1 January 2003 to 31 December 2005. [NPR]
Vesterinen, R., 1996: Greenhouse gas emissions from composting. SIHTI-Research Programme, Seminar 13-14 March 1996, Hanasaari, Espoo, Finland, 3 pp. In Finnish. [NPR]
WHO-UNICEF, 2005: Joint Monitoring Programme: Worldwide Sanitation. <http://www.who.int/water_sanitation_health/monitoring/jmp2005/en/index.html> accessed 25/06/07. [NPR]
WHO/UNICEF/WSSCC, 2000: Global water supply and sanitation assessment: 2000 Report. WHO/UNICEF Joint Monitoring Programme for Water Supply and Sanitation, ISBN924156202 1, 2000. <http://www.who.int> [NPR]
Willumsen, H.C., 2003: Landfill gas plants: number and type worldwide. Proceedings of the Sardinia ‘05, International Solid and Hazardous Waste Symposium, October 2005, published by CISA, University of Cagliari, Sardinia. [NPR]
World Bank, 1997: Toolkits for private sector participation in water and sanitation. World Bank, Washington D.C. [NPR]
World Bank, 2005a: World Development Indicators 2005: Environment, Table 2.15 Disease Prevention: Coverage and Quality. Table 3.6: Water pollution, Table 3.11: Urban Environment, <http://www.worldbank.org/data/wdi2005/wditext> accessed 25/06/07. [NPR]
World Bank, 2005b: Global Monitoring Report 2005, Chapter 3: Scaling up service delivery, WHO and UNICEF joint monitoring program, Washington, D.C. [NPR]
World Bank and IMF, 2006: Global Monitoring Report 2006: Ensuring Environmental Sustainability Target 10. World Bank and International Monetary Fund, Washington, D.C. [NPR]
WRAP, 2006: Environmental benefits of recycling, an international review of life cycle comparisons for key materials in the UK recycling sector. Waste and Resources Action Program, Peer reviewed report prepared by H. Wenzel et al., Danish Technical University, published by WRAP, Banbury, Oxfordshire, England. [NPR]
Yamakawa, H. and K. Ueta, 2002: Waste reduction through variable charging programs: its sustainability and contributing factors. Journal of Material Cycles and Waste Management, 4, pp. 77-86. Clean
Yuan, Z., J. Bi, and Y. Moriguchi, 2006: The circular economy-a new development strategy in China. Journal of Industrial Ecology 10, pp. 4-8. Clean
Zinati, G.M., Y.C. Li, and H.H. Bryan, 2001: Utilization of compost increases organic carbon and its humin, humic, and fulvic acid fractions in calcareous soil. Compost Science & Utilization 9, pp. 156-162. Clean
| Tag | Explanation | Occurrences | Percentages |
|---|---|---|---|
| PoC |
Person of Concern Key individual involved in CRU emails as defined in this spreadsheet. |
1 | 0.5% |
| JoC |
Journal of Concern A Journal which has published articles by one or more PoCs (Person of Concern) |
7 | 3% |
| MoS |
Model or Simulation Reference appears to be a model or simulation, not observation or experiment. |
17 | 8% |
| NPR |
Non Peer Reviewed Reference has no Journal or no Volume or no Pages or it has Editors. |
108 | 56% |
| SRC |
Self Reference Concern Author of a chapter containing references to own work. |
29 | 15% |
| ARC |
Paper authored or co-authored by person who is also in list of Authors of another chapter. |
5 | 2% |
| 2007 |
Paper dated 2007, when IPCC policy stated cutoff was December 2005 |
3 | 1% |
| Clean |
The reference was probably peer reviewed. |
51 | 26% |
NOTE: In the Summary of Reviewer Comments,
Accepted includes only those responses that were unambiguously Accepted.
There are other categories of responses that we have not yet quantified
due to inconsistencies of usage.
| Reviewer | Total Comments | Accepted | IPCC Roles | Papers |
|---|---|---|---|---|
| Government of U.S. Department of State | 83 | 14 | 0 | 0 |
| Government of India | 21 | 6 | 0 | 1 |
| Bahor, Brian | 18 | 2 | 0 | 0 |
| Government of Germany | 18 | 3 | 0 | 0 |
| Cointreau, S | 15 | 1 | 0 | 1 |
| Guendehou, GH | 13 | 7 | 0 | 0 |
| Anderson, Peter | 13 | 0 | 0 | 0 |
| Government of Finland | 7 | 5 | 0 | 0 |
| Government of Norwegian Pollution Control Authority | 7 | 2 | 0 | 0 |
| Macey, Kirsten | 7 | 0 | 0 | 0 |
| Read, P | 6 | 0 | 1 | 2 |
| Government of Australia | 6 | 1 | 0 | 1 |
| Bernstein, L | 6 | 2 | 3 | 0 |
| Caserini, Stefano | 6 | 5 | 0 | 0 |
| Government of Sweden | 5 | 1 | 0 | 0 |
| Nyboer, J | 4 | 2 | 0 | 5 |
| Ackerman, F | 3 | 0 | 0 | 1 |
| Bonduelle, Antoine | 3 | 0 | 0 | 0 |
| Government of Japan | 2 | 0 | 0 | 2 |
| Lorea, Claude | 2 | 1 | 0 | 0 |
| Roy, J | 2 | 0 | 2 | 4 |
| Government of China Meteorological Administration | 2 | 1 | 0 | 0 |
| Onuma, E | 2 | 0 | 0 | 1 |
| Izumi, Y | 2 | 0 | 0 | 1 |
| Government of France | 1 | 0 | 0 | 0 |
| IPCC | 1 | 1 | 0 | 50 |
| Totals | 255 | 54 | 6 | 69 |
| Reviewer Type | Total Comments | Accepted | % Accepted |
|---|---|---|---|
| Govt | 123 | 26 | 21% |
| IPCC | 70 | 13 | 18% |
| Indep | 62 | 15 | 24% |
| Total | 255 | 54 | 21% |
Main AR4 Index | Working Group WG3 Index | Table of Contents | Authors | Executive Summary | Annotated Text | References | Reviewer Comments