Working Group 3 - Chapter 4: Energy Supply - (AR4-WG3-4)
Original at: http://www.ipcc.ch/publications_and_data/ar4/wg3/en/ch4.html
Main AR4 Index | Working Group WG3 Index | Table of Contents | Authors | Executive Summary | Annotated Text | References | Reviewer Comments
With the exception of Chapter and Section headings, all coloured text has been inserted by AccessIPCC. The non-coloured text is the IPCC original.
A number of emails from the Climate Research Unit (CRU) of the University of East Anglia were published on the Internet in November 2009. This has provided a window into the world of climate science.
We have identified a number of key individuals involved in the emails whom we have designated as Persons of Concern [PoC]; a Journal in which a PoC has published has been designated as a Journal of Concern [JoC].
This is not to suggest that we believe such papers are necessarily flawed, but rather that, as Joseph Alcamo noted at Bali in October 2009, "as policymakers and the public begin to grasp the multi-billion dollar price tag for mitigating and adapting to climate change, we should expect a sharper questioning of the science behind climate policy".
References occur in a list at the end of each chapter. Citations are within the normal text of sections and paragraphs.
| Tag | Explanation | Where Used | References | Citations |
|---|---|---|---|---|
| PoC |
Person of Concern Key individual involved in CRU emails as defined in this spreadsheet. |
References, Citations, IPCC Roles | - | - |
| JoC |
Journal of Concern A Journal which has published articles by one or more PoCs (Person of Concern) |
References, Citations | 13 | 7 |
| MoS |
Model or Simulation Reference appears to be a model or simulation, not observation or experiment |
References, Citations | 50 | 36 |
| NPR |
Non Peer Reviewed Reference has no Journal or no Volume or no Pages or it has Editors. |
References, Citations | 580 | 520 |
| SRC |
Self Reference Concern Author of a chapter containing references to own work. |
References, Citations, IPCC Roles | 28 | 34 |
| ARC |
Paper authored or co-authored by person who is also in list of Authors of another chapter. |
References, Citations | 23 | 24 |
| 2007 |
Paper dated 2007, when IPCC policy stated cutoff was December 2005 |
References, Citations | 2 | - |
| Ambiguous |
The short inline citation matched with more than one reference; however, AccessIPCC will link to the first reference found. |
Citations | - | 21 |
| NotFound |
The short inline citation was not matched with any reference. Believed to be caused by typing errors. |
Citations | - | 4 |
| Clean |
The reference was probably peer reviewed. |
References, Citations | 66 | 38 |
Coordinating Lead Authors:
Ralph E.H. Sims (New Zealand) [SRC:5], Robert N. Schock (USA),
| Concern | Occurrence |
|---|---|
| SRC >= 5 | 1 |
| Potentially Biased Authors | 1 |
| Impartial Authors | 1 |
Lead Authors:
Anthony Adegbululgbe (Nigeria), Jørgen Fenhann (Denmark) [SRC:1], Inga Konstantinaviciute (Lithuania), William Moomaw (USA), Hassan B. Nimir (Sudan), Bernhard Schlamadinger (Austria) [SRC:1], Julio Torres-Martínez (Cuba), Clive Turner (South Africa), Yohji Uchiyama (Japan) [SRC:2], Seppo J.V. Vuori (Finland), Njeri Wamukonya (Kenya) [SRC:1], Xiliang Zhang (China),
| Concern | Occurrence |
|---|---|
| SRC 1-4 | 4 |
| Potentially Biased Authors | 4 |
| Impartial Authors | 8 |
Contributing Authors:
Arne Asmussen (Germany), Stephen Gehl (USA) [SRC:1], Michael Golay (USA) [SRC:1], Eric Martinot (USA) [SRC:2],
| Concern | Occurrence |
|---|---|
| SRC 1-4 | 3 |
| Potentially Biased Authors | 3 |
| Impartial Authors | 1 |
Review Editors:
Hans Larsen (Denmark), José Roberto Moreira (Brazil),
| Concern | Occurrence |
|---|---|
| Impartial Authors | 2 |
This chapter should be cited as:
R.E.H. Sims, R.N. Schock, A. Adegbululgbe, J. Fenhann, I. Konstantinaviciute, W. Moomaw, H.B. Nimir, B. Schlamadinger,
EXECUTIVE SUMMARY
Annual total greenhouse gas (GHG) emissions arising from the global energy supply sector continue to increase. Combustion of fossil fuels continues to dominate a global energy market that is striving to meet the ever-increasing demand for heat, electricity and transport fuels. GHG emissions from fossil fuels have increased each year since the IPCC 2001 [NPR] Third Assessment Report (TAR) ( IPCC, 2001 [NPR] ), despite greater deployment of low- and zero-carbon technologies, (particularly those utilizing renewable energy); the implementation of various policy support mechanisms by many states and countries; the advent of carbon trading in some regions, and a substantial increase in world energy commodity prices. Without the near-term introduction of supportive and effective policy actions by governments, energy-related GHG emissions, mainly from fossil fuel combustion, are projected to rise by over 50% from 26.1 GtCO2eq (7.1 GtC) in 2004 to 37–40 GtCO2 (10.1–10.9 GtC) by 2030 . Mitigation has therefore become even more challenging.
Global dependence on fossil fuels has led to the release of over 1100 GtCO2 into the atmosphere since the mid-19th century. Currently, energy-related GHG emissions, mainly from fossil fuel combustion for heat supply, electricity generation and transport, account for around 70% of total emissions including carbon dioxide, methane and some traces of nitrous oxide ( Chapter 1 ). To continue to extract and combust the world’s rich endowment of oil, coal, peat, and natural gas at current or increasing rates, and so release more of the stored carbon into the atmosphere, is no longer environmentally sustainable, unless carbon dioxide capture and storage (CCS) technologies currently being developed can be widely deployed (high agreement, much evidence).
There are regional and societal variations in the demand for energy services. The highest per-capita demand is by those living in Organisation for Economic Co-operation and Development (OECD) economies, but currently, the most rapid growth is in many developing countries. Energy access, equity and sustainable development are compromised by higher and rapidly fluctuating prices for oil and gas. These factors may increase incentives to deploy carbon-free and low-carbon energy technologies, but conversely, could also encourage the market uptake of coal and cheaper unconventional hydrocarbons and technologies with consequent increases in carbon dioxide (CO2) emissions.
Energy access for all will require making available basic and affordable energy services using a range of energy resources and innovative conversion technologies while minimizing GHG emissions, adverse effects on human health, and other local and regional environmental impacts. To accomplish this would require governments, the global energy industry and society as a whole to collaborate on an unprecedented scale. The method used to achieve optimum integration of heating, cooling, electricity and transport fuel provision with more efficient energy systems will vary with the region, local growth rate of energy demand, existing infrastructure and by identifying all the co-benefits (high agreement, much evidence).
The wide range of energy sources and carriers that provide energy services need to offer long-term security of supply, be affordable and have minimal impact on the environment. However, these three government goals often compete. There are sufficient reserves of most types of energy resources to last at least several decades at current rates of use when using technologies with high energy-conversion efficient designs. How best to use these resources in an environmentally acceptable manner while providing for the needs of growing populations and developing economies is a great challenge.
- Conventional oil reserves will eventually peak as will natural gas reserves, but it is uncertain exactly when and what will be the nature of the transition to alternative liquid fuels such as coal-to-liquids, gas-to-liquids, oil shales, tar sands, heavy oils, and biofuels. It is still uncertain how and to what extent these alternatives will reach the market and what the resultant changes in global GHG emissions will be as a result.
- Conventional natural gas reserves are more abundant in energy terms than conventional oil, but they are also distributed less evenly across regions. Unconventional gas resources are also abundant, but future economic development of these resources is uncertain.
- Coal is unevenly distributed, but remains abundant. It can be converted to liquids, gases, heat and power, although more intense utilization will demand viable CCS technologies if GHG emissions from its use are to be limited.
- There is a trend towards using energy carriers with increased efficiency and convenience, particularly away from solid fuels to liquid and gaseous fuels and electricity.
- Nuclear energy, already at about 7% of total primary energy, could make an increasing contribution to carbon-free electricity and heat in the future. The major barriers are: long-term fuel resource constraints without recycling; economics; safety; waste management; security; proliferation, and adverse public opinion.
- Renewable energy sources (with the exception of large hydro) are widely dispersed compared with fossil fuels, which are concentrated at individual locations and require distribution. Hence, renewable energy must either be used in a distributed manner or concentrated to meet the higher energy demands of cities and industries.
- Non-hydro renewable energy-supply technologies, particularly solar, wind, geothermal and biomass, are currently small overall contributors to global heat and electricity supply, but are the most rapidly increasing. Costs, as well as social and environmental barriers, are restricting this growth. Therefore, increased rates of deployment may need supportive government policies and measures.
- Traditional biomass for domestic heating and cooking still accounts for more than 10% of global energy supplies but could eventually be replaced, mainly by modern biomass and other renewable energy systems as well as by fossil-based domestic fuels such as kerosene and liquefied petroleum gas (LPG) (high agreement, much evidence – except traditional biomass).
Security of energy supply issues and perceived future benefits from strategic investments may not necessarily encourage the greater uptake of lower carbon-emitting technologies. The various concerns about the future security of conventional oil, gas and electricity supplies could aid the transition to more low-carbon technologies such as nuclear, renewables and CCS. However, these same concerns could also encourage the greater uptake of unconventional oil and gaseous fuels as well as increase demand for coal and lignite in countries with abundant national supplies and seeking national energy-supply security.
Addressing environmental impacts usually depends on the introduction of regulations and tax incentives rather than relying on market mechanisms. Large-scale energy-conversion plants with a life of 30–100 years give a slow rate of turnover of around 1–3% per year. Thus, decisions taken today that support the deployment of carbon-emitting technologies, especially in countries seeking supply security to provide sustainable development paths, could have profound effects on GHG emissions for the next several decades. Smaller-scale, distributed energy plants using local energy resources and low- or zero-carbon emitting technologies, can give added reliability, be built more quickly and be efficient by utilizing both heat and power outputs locally (including for cooling).
Distributed electricity systems can help reduce transmission losses and offset the high investment costs of upgrading distribution networks that are close to full capacity.
More energy-efficient technologies can also improve supply security by reducing future energy-supply demands and any associated GHG emissions. However, the present adoption path for these, together with low- and zero-carbon supply technologies, as shown by business-as-usual baseline scenarios, will not reduce emissions significantly.
The transition from surplus fossil fuel resources to constrained gas and oil carriers, and subsequently to new energy supply and conversion technologies, has begun. However it faces regulatory and acceptance barriers to rapid implementation and market competition alone may not lead to reduced GHG emissions. The energy systems of many nations are evolving from their historic dependence on fossil fuels in response to the climate change threat, market failure of the supply chain, and increasing reliance on global energy markets, thereby necessitating the wiser use of energy in all sectors. A rapid transition toward new energy supply systems with reduced carbon intensity needs to be managed to minimize economic, social and technological risks and to co-opt those stakeholders who retain strong interests in maintaining the status quo. The electricity, building and industry sectors are beginning to become more proactive and help governments make the transition happen. Sustainable energy systems emerging as a result of government, business and private interactions should not be selected on cost and GHG mitigation potential alone but also on their other co-benefits.
Innovative supply-side technologies, on becoming fully commercial, may enhance access to clean energy, improve energy security and promote environmental protection at local, regional and global levels. They include thermal power plant designs based on gasification; combined cycle and super-critical boilers using natural gas as a bridging fuel; the further development and uptake of CCS; second-generation renewable energy systems; and advanced nuclear technologies. More efficient energy supply technologies such as these are best combined with improved end-use efficiency technologies to give a closer matching of energy supply with demand in order to reduce both losses and GHG emissions.
Energy services are fundamental to achieving sustainable development. In many developing countries, provision of adequate, affordable and reliable energy services has been insufficient to reduce poverty and improve standards of living. To provide such energy services for everyone in an environmentally sound way will require major investments in the energy-supply chain, conversion technologies and infrastructure (particularly in rural areas) (high agreement, much evidence).
There is no single economic technical solution to reduce GHG emissions from the energy sector. There is however good mitigation potential available based on several zero-or low-carbon commercial options ready for increased deployment at costs below 20 US$/tCO2 avoided or under research development. The future choice of supply technologies will depend on the timing of successful developments for advanced nuclear, advanced coal and gas, and second-generation renewable energy technologies. Other technologies, such as CCS, second-generation biofuels, concentrated solar power, ocean energy and biomass gasification, may make additional contributions in due course. The necessary transition will involve more sustained public and private investment in research, development, demonstration and deployment (RD3) to better understand our energy resources, to further develop cost-effective and -efficient low- or zero-carbon emitting technologies, and to encourage their rapid deployment and diffusion. Research investment in energy has varied greatly from country to country, but in most cases has declined significantly in recent years since the levels achieved soon after the oil shocks during the 1970 s.
Using the wide range of available low- and zero-carbon technologies (including large hydro, bioenergy, other renewables, nuclear and CCS together with improved power-plant efficiency and fuel switching from coal to gas), the total mitigation potential by 2030 for the electricity sector alone, at carbon prices below 20 US$/tCO2-eq, ranges between 2.0 and 4.2 GtCO2-eq/yr. At the high end of this range, the over 70% share of fossil fuel-based power generation in the baseline drops to 55% of the total. Developing countries could provide around half of this potential. This range corresponds well with the TAR analysis potential of 1.3–2.5 GtCO2-eq/yr at 27 US$/tCO2-eq avoided, given that the TAR was only up to 2020 and that, since it was published in 2001, there has been an increase in development and deployment of renewable energy technologies, a better understanding of CCS techniques and a greater acceptance of improved designs of nuclear power plants.
For investment costs up to 50 US$/tCO2-eq, the total mitigation potential by 2030 rises to between 3.0 and 6.4 GtCO2-eq/yr avoided. Up to 100 US$/tCO2-eq avoided, the total potential is between 4.0 and 7.2 GtCO2-eq/yr, mainly coming from non-OECD/EIT countries (medium agreement, limited evidence).
There is high agreement in the projections that global energy supply will continue to grow and in the types of energy likely to be used by 2030 . However, there is only medium confidence in the regional energy demand assumptions and the future mix of conversion technologies to be used. Overall, the future costs and technical potentials identified should provide a reasonable basis for considering strategies and decisions over the next several decades.
No single policy instrument will ensure the desired transition to a future secure and decarbonized world. Policies will need to be regionally specific and both energy and non-energy co-benefits should be taken into account. Internalizing environmental costs requires development of policy initiatives, long-term vision and leadership based on sound science and economic analysis. Effective policies supporting energy-supply technology development and deployment are crucial to the uptake of low-carbon emission systems and should be regionally specific. A range of policies is already in place to encourage the development and deployment of low-carbon-emitting technologies in OECD countries as well as in non-OECD countries including Brazil, Mexico, China and India. Policies in several countries have resulted in the successful implementation of renewable energy systems to give proven benefits linked with energy access, distributed energy, health, equity and sustainable development. Nuclear energy policies are also receiving renewed attention. However, the consumption of fossil fuels, at times heavily subsidized by governments, will remain dominant in all regions to meet ever-increasing energy demands unless future policies take into account the full costs of environmental, climate change and health issues resulting from their use.
Energy sector reform is critical to sustainable energy development and includes reviewing and reforming subsidies, establishing credible regulatory frameworks, developing policy environments through regulatory interventions, and creating market-based approaches such as emissions trading. Energy security has recently become an important policy driver. Privatization of the electricity sector has secured energy supply and provided cheaper energy services in some countries in the short term, but has led to contrary effects elsewhere due to increasing competition, which, in turn, leads to deferred investments in plant and infrastructure due to longer-term uncertainties. In developed countries, reliance on only a few suppliers, and threats of natural disasters, terrorist attacks and future uncertainty about imported energy supplies add to the concerns. For developing countries lack of security and higher world-energy prices constrain endeavours to accelerate access to modern energy services that would help to decrease poverty, improve health, increase productivity, enhance competition and thus improve their economies (high agreement, much evidence).
In short, the world is not on course to achieve a sustainable energy future. The global energy supply will continue to be dominated by fossil fuels for several decades. To reduce the resultant GHG emissions will require a transition to zero- and low-carbon technologies. This can happen over time as business opportunities and co-benefits are identified. However, more rapid deployment of zero- and low-carbon technologies will require policy intervention with respect to the complex and interrelated issues of: security of energy supply; removal of structural advantages for fossil fuels; minimizing related environmental impacts, and achieving the goals for sustainable development.
4.1 Introduction
This chapter addresses the energy-supply sector and analyses the cost and potential of greenhouse gas (GHG) mitigation from the uptake of low- and zero-carbon-emitting technologies (including carbon capture and storage) over the course of the next two to three decades. Business-as-usual fossil-fuel use to meet future growth in energy demand will produce significant increases in GHG emissions. To make a transition by 2030 will be challenging. Detailed descriptions of the various technologies have been kept to a minimum, especially for those that have changed little since the Third Assessment Report (TAR) as they are well covered elsewhere (e.g., IEA, 2006a [NPR] ).
The main goal of all energy transformations is to provide energy services that improve quality of life (e.g. health, life expectancy and comfort) and productivity ( Hall et al., 2004 [Ambiguous] ). A supply of secure, equitable, affordable and sustainable energy is vital to future prosperity. Approximately 45% of final consumer energy is used for low-temperature heat (cooking, water and space heating, drying), 10% for high-temperature industrial process heat, 15% for electric motors, lighting and electronics and 30% for transport. The CO2 emissions from meeting this energy demand using mainly fossil fuels account for around 80% of total global emissions ( IEA, 2006b [NPR] ). Demands for all forms of energy continue to rise to meet expanding economies and increases in world population. Rising prices and concerns about insecure energy supplies will compromise growth in fossil fuel consumption.
Energy supply is intimately tied in with development in the broad sense. At present, the one billion people living in developed (OECD) countries consume around half of the 470 EJ current annual global primary energy use ( IEA, 2006b [NPR] ), whereas the one billion poorest people in developing countries consume only around 4%, mainly in the form of traditional biomass used inefficiently for cooking and heating. The United Nations has set Millennium Development Goals to eradicate poverty, raise living standards and encourage sustainable economic and social development ( UN, 2000 [NPR] ). Economic policies aimed at sustainable development can bring a variety of co-benefits including utilizing new energy technologies and improved access to adequate and affordable modern energy services. This will determine how many humans can expect to achieve a decent standard of living in the future ( Section 4.5.4 ; Chapter 3 ).
There are risks to being unprepared for future energy-supply constraints and disruptions. Currently, fossil fuels provide almost 80% of world energy supply; a transition away from their traditional use to zero- and low-carbon-emitting modern energy systems (including carbon dioxide capture and storage (CCS) ( IPCC, 2005 [NPR] ), as well as improved energy efficiency, would be part solutions to GHG-emission reduction. It is yet to be determined which technologies will facilitate this transition and which policies will provide appropriate impetus, although security of energy supply, aligned with GHG-reduction goals, are co-policy drivers for many governments wishing to ensure that future generations will be able to provide for their own well-being without their need for energy services being compromised.
A mix of options to lower the energy per unit of GDP and carbon intensity of energy systems (as well as lowering the energy intensity of end uses) will be needed to achieve a truly sustainable energy future in a decarbonized world. Energy-related GHG emissions are a by-product of the conversion and delivery sector (which includes extraction/refining, electricity generation and direct transport of energy carriers in pipelines, wires, ships, etc.), as well as the energy end-use sectors (transport, buildings, industry, agriculture, forestry and waste), as outlined in Chapters 5 to 10 ( Figure 4.1 ).
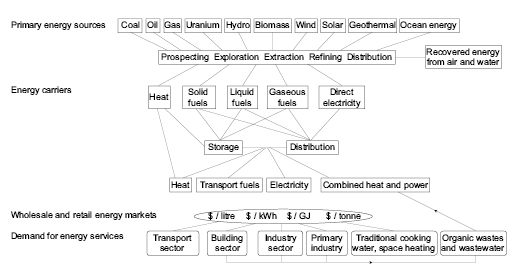
Figure 4.1: Complex interactions between primary energy sources and energy carriers to meet societal needs for energy services as used by the transport ( Chapter 5 ), buildings (6), industry (7) and primary industry (8 and 9) sectors.
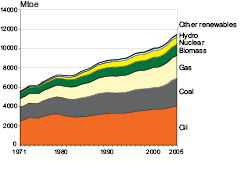
In all regions of the world energy demand has grown in recent years ( Figure 4.2 ). A 65% global increase above the 2004 primary energy demand (464 EJ, 11,204 Mtoe) is anticipated by 2030 under business as usual ( IEA, 2006b [NPR] ). Major investment will be needed, mostly in developing countries. As a result, without effective mitigation, total energy-related carbon dioxide emissions (including transformations, own use and losses) will rise from 26.1 GtCO2 (7.2 GtC) in 2004 to around 37–40 GtCO2 (11.1 GtC) in 2030 ( IEA, 2006b [NPR] ; Price and de la Rue du Can, 2006 [NPR, ARC] ), possibly even higher ( Fisher, 2006 [NPR, ARC] ), assuming modest energy-efficiency improvements are made to technologies currently in use. This means that all cost-effective means of reducing carbon emissions would need to be deployed in order to slow down the rate of increase of atmospheric concentrations ( WBCSD, 2004 [NPR] ; Stern, 2006 [NPR] ).
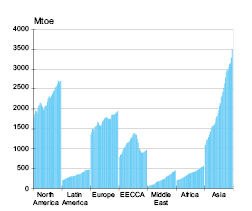
Note: EECCA = countries of Eastern Europe, the Caucasus and Central Asia. 1000 Mtoe = 42 EJ.
Figure 4.2: Global annual primary energy demand (including traditional biomass), 1971 – 2003 by region.
Implementing any major energy transition will take time. The penetration rates of emerging energy technologies depend on the expected lifetime of capital stock, equipment and the relative cost. Some large-scale energy-conversion plants can have an operational life of up to 100 years giving a slow rate of turnover, but around 2–3% per year replacement rate is more usual ( Section 4.4.3 ). There is, therefore, some resistance to change, and breakthroughs in technology to increase penetration rate are rare.
Technology only diffuses rapidly once it can compete economically with existing alternatives or offers added value (e.g. greater convenience), often made possible by the introduction of new regulatory frameworks. It took decades to provide the large-scale electricity and natural-gas infrastructures now common in many countries. Power stations, gas and electricity distribution networks and buildings are usually replaced only at the end of their useful life, so early action to stabilize atmospheric GHGs to have minimal impact on future GDP, it is important to avoid building ‘more of the same’ ( Stern, 2006 [NPR] ).
Total annual capital investment by the global energy industry is currently around 300 billion US$. Even allowing for improved energy efficiency, if global energy demand continues to grow along the anticipated trajectory, by 2030 the investment over this period in energy-carrier and -conversion systems will be over 20 trillion (1012) US$, being around 10% of world total investment or 1% of cumulative global GDP ( IEA, 2006b [NPR] ). This will require investment in energy-supply systems of around 830 billion US$/yr, mainly to provide an additional 3.5 TW of electricity-generation plant and transmission networks, particularly in developing countries, and provide opportunities for a shift towards more sustainable energy systems. Future investment in state-of-the-art technologies in countries without embedded infrastructure may be possible by ‘leapfrogging’ rather than following a similar historic course of development to that of OECD nations. New financing facilities are being considered because of the G8 Gleneagles Communiqué on Climate Change, Clean Energy and Sustainable Development of July 2005 (World Bank, 2006 [NPR] ).
It is uncertain how future investments will best meet future energy demand while achieving atmospheric GHG stabilization goals. There are many possible scenarios somewhere between the following extremes ( WEC, 2004a [NPR] ).
- High demand growth, giving very large productivity increases and wealth. Being technology- and resource-intensive, investment in technological changes would yield rapid stock turnover with consequent improvements in energy intensity and efficiency.
- Reduced energy demand, with an investment goal to reduce CO2 emissions by one per cent per year by 2100. This would be technologically challenging and assumes unprecedented progressive international cooperation focused explicitly on developing a low-carbon economy that is both equitable and sustainable, requiring improvements in end-use efficiency and aggressive changes in lifestyle to emphasize resource conservation and dematerialization.
The last century has seen a decline in the use of solids relative to liquids and gases. In the future, the use of gases is expected to increase ( Section 4.3.1 ). The share of liquids will probably remain constant but with a gradual transition from conventional oil ( Section 4.3.1.3 ) toward coal-to-liquids, unconventional oils ( Section 4.3.1.4 ) and modern biomass ( Section 4.3.3.3 ).
A robust mix of energy sources (fossil, renewable and nuclear), combined with improved end-use efficiency, will almost certainly be required to meet the growing demand for energy services, particularly in many developing countries. Technological development, decentralized non-grid networks, diversity of energy-supply systems and affordable energy services are imperative to meeting future demand. In many OECD countries, historical records show a decrease in energy per capita. Energy reduction per unit of GDP is also becoming apparent with respect to energy supplies in developing countries such as China ( Larson et al., 2003 [MoS, ARC] ).
4.1.1 Summary of Third Assessment Report (TAR)
Energy-supply and end-use-efficiency technology options (Table 3.36, TAR) showed special promise for reducing CO2 emissions from the industrial and energy sectors. Opportunities included more efficient electrical power generation from fossil fuels, greater use of renewable technologies and nuclear power, utilization of transport biofuels, biological carbon sequestration and CCS. It was estimated that potential reductions of 350–700 MtC/yr (1.28–2.57 GtCO2-eq/yr) were possible in the energy supply and conversion sector by 2020 for <100 US$/C (27.3 US$/tCO2) (Table 3.37, TAR) divided equally between developed and developing countries. Improved end-use efficiency held greater potential for reductions.
There are still obstacles to implementing the low-carbon technologies and measures identified in the TAR. These include a lack of human and institutional capacity; regulatory impediments and imperfect capital markets that discourage investment, including for decentralized systems; uncertain rates of return on investment; high trade tariffs on emission-lowering technologies; lack of market information, and intellectual property rights issues. Adoption of renewable energy is constrained by high investment costs, lack of capital, government support for fossil fuels and lack of government support mechanisms.
The problem of ‘lock-in’ by existing technologies and the economic, political, regulatory, and social systems that support them were seen as major barriers to the introduction of low-emission technologies in all types of economies. This has not changed. Several technological innovations such as ground-source heat pumps, solar photovoltaic (PV) roofing, and offshore wind turbines have been recently introduced into the market as a result of multiple drivers including economic profit or productivity gains, non-energy-related benefits, tax incentives, environmental benefits, performance efficiency and other regulations. Lower GHG emissions were not always a major driver in their adoption. Policy changes in development assistance (Renewables, 2004 ) and direct foreign investment provide opportunities to introduce low-emission technologies to developing countries more rapidly.
4.2 Status of the sector
Providing energy services from a range of sources to meet society’s demands should offer security of supply, be affordable and have minimal impact on the environment. However, these three goals often conflict. Recent liberalization of energy markets in many countries has led to cheaper energy services in the short term, but in the longer term, investments with longer write-off periods and often lower returns (including nuclear power plants and oil refineries) are not always being made due to the need to maximize value for short-term shareholders. Energy-supply security has improved in some countries but deteriorated elsewhere due to increasing competition, which, because of insecurity, leads to deferred investments in grid and plants. Addressing environmental impacts, including climate change, usually depends on laws and tax incentives rather than market mechanisms ( Section 13.2.1.1 ).
Primary energy sources are: fossil carbon fuels; geothermal heat; fissionable, fertile and fusionable nuclides; gravitational (tides) and rotational forces (ocean currents), and the solar flux. These must be extracted, collected, concentrated, transformed, transported, distributed and stored (if necessary) using technologies that consume some energy at every step of the supply chain ( Figure 4.3 ). The solar flux provides both intermittent energy forms including wind, waves and sunlight, and stored energy in biomass, ocean thermal gradients and hydrologic supplies. Energy carriers such as heat, electricity and solid, liquid and gaseous fuels deliver useful energy services. The conversion of primary energy-to-energy carriers and eventually to energy services creates losses, which, together with distribution losses, represent inefficiencies and cost of delivery ( Figure 4.4 ).
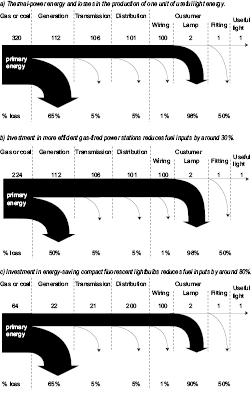
Figure 4.3: The conversion from primary energy to carriers and end-uses is an essential driver of efficiency, exemplified here by the case of lighting. Primary fuel inputs can be reduced using more efficient generation plants, but also to a greater degree by more energy-efficient technologies (as described in Chapters 5 , 6 and 7 )
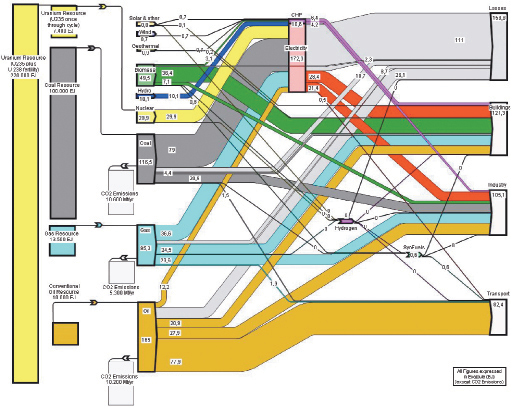
Figure 4.4: Global energy flows (EJ in 2004 ) from primary energy through carriers to end-uses and losses. Related carbon dioxide emissions from coal, gas and oil combustion are also shown, as well as resources (vertical bars to the left).
Analysis of energy supply should be integrated with energy carriers and end use since all these aspects are inextricably and reciprocally dependent. Energy-efficiency improvements in the conversion of primary energy resources into energy carriers during mining, refining, generation etc. continue to occur but are relatively modest. Reducing energy demand by the consumer using more efficient industrial practices, buildings, vehicles and appliances also reduces energy losses (and hence CO2 emissions) along the supply chain and is usually cheaper and more efficient than increasing the supply capacity (Chapters 5 , 6 and 7 and Figure 4.3 ).
Since 1971, oil and coal remain the most important primary energy sources with coal increasing its share significantly since 2000 ( Figure 4.5 ). Growth slowed in 2005 and the total share of fossil fuels dropped from 86% in 1971 to 81% in 2004, ( IEA, 2006b [NPR] ) excluding wind, solar, geothermal, bioenergy and biofuels, as well as non-traded traditional biomass. Combustible biomass and wastes contributed approximately 10% of primary energy consumption ( IEA, 2006b [NPR] ) with more than 80% used for traditional fuels for cooking and heating in developing countries.
Around 40% of global primary energy was used as fuel to generate 17,408 TWh of electricity in 2004 ( Figure 4.4 ). Electricity generation has had an average growth rate of 2.8%/yr since 1995 and is expected to continue growing at a rate of 2.5–3.1%/yr until 2030 ( IEA, 2006b [NPR] ; Enerdata, 2004 ). In 2005, hard coal and lignite fuels were used to generate 40% of world electricity production with natural gas providing 20%, nuclear 16%, hydro 16%, oil 7% and other renewables 2.1% ( IEA 2006b [NPR] ). Non-hydro renewable energy power plants have expanded substantially in the past decade with wind turbine and solar PV installations growing by over 30% annually. However, they still supply only a small portion of electricity generation (Enerdata, 2004 ).
Many consumers of petroleum and, to a lesser degree, natural gas depend to varying but significant amounts of fuels imported from distant, often politically unstable regions of the world and transported through a number of locations equally vulnerable to disruptions. For example, in 2004 16.5–17 Mbbl/d of oil was shipped through the Straits of Hormuz in the Persian Gulf and 11.7 Mbbl/d through the Straits of Malacca in Asia (EIA/DOE, 2005 ). A disruption in supply at either of these points could have a severe impact on global oil markets. Political unrest in some oil and gas producing regions of Middle East, Africa and Latin America has also highlighted the vulnerability of supply. When international trade in oil and gas expands in the near future, the risks of supply disruption may increase leading to more serious impacts ( IEA, 2004b [NPR] ; CIEP, 2004 [NPR] ). This is a current driver for shifting to less vulnerable renewable energy resources.
Whereas fossil fuel sources of around 100,000 W/m2 land area have been discovered at individual locations, extracted and then distributed, renewable energy is usually widely dispersed at densities of 1–5 W/m2 and hence must either be used in a distributed manner or concentrated to meet the high energy demands of cities and industries. For renewable energy systems, variations in climate may produce future uncertainties result from dry years for hydro, poor crop yields for biomass, increased cloud cover and materials costs for solar, and variability in annual wind speeds. However, over their lifetime they are relatively price-stable sources and in a mixed portfolio of technologies can avoid losses from fluctuating oil, gas and power prices ( Awerbuch and Sauter, 2005 [NPR] ) unless their owner also has to sell based on volatile short-term prices ( (Roques et al., 2006 ) ). World oil and gas prices in 2005 and 2006 were significantly higher than most pre- 2005 scenario models predicted. This might lead to a reduction in transportation use and GHG emissions ( Chapter 5 ), but conversely could also encourage a shift to coal-fired power plants. Hence, high energy prices do not necessarily mean increased investments in low carbon technologies or lower GHG emissions.
For nuclear power, investment uncertainties exist due to financial markets commanding a higher interest rate to cover perceived risks, thus increasing the cost of capital and thereby generation costs. Increasing environmental concerns will also raise the costs of obtaining permits. Conversely, surplus uranium supplies may possibly lower fuel prices, but this represents a relatively low fraction of generation costs compared with fossil-fuel power stations ( Hagen et al., 2005 [NPR] ).
4.2.1 Global development trends in the energy sector (production and consumption)
From 1900 to 2000, world primary energy increased more than ten-fold, while world population rose only four-fold from 1.6 billion to 6.1 billion. Most energy forecasts predict considerable growth in demand in the coming decades due to increasing economic growth rates throughout the world but especially in developing countries. Global primary-energy consumption rose from 238 EJ in 1972 to 464 EJ in 2004 ( Chapter 1 ). During the period 1972 to 1990, the average annual growth was 2.4%/yr, dropping to 1.4%/yr from 1990 to 2004 due to the dramatic decrease in energy consumption in the former Soviet Union (FSU) ( Figure 4.2 ) and to energy intensity improvements in OECD countries. The highest growth rate in the last 14 years was in Asia (3.2%/yr).
Low electrification rates correlate with slow socio-economic development. The average rates in the Middle East, North Africa, East Asia/China and Latin America have resulted in grid connection for over 85% of their populations, whereas sub-Saharan Africa is only 23% (but only 8% in rural regions) and South Asia is 41% (30% in rural regions) ( IEA, 2005c [NPR] ).
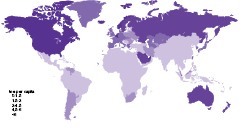
There is a large discrepancy between primary energy consumption per capita of 336 GJ/yr for the average North American to around 26 GJ/yr for the average African (Enerdata, 2004 ). The region with the lowest per-capita consumption has changed from Asian developing countries in 1972 to African countries today.
4.2.2 Emission trends of all GHGs
Growing global dependence on coal, oil and natural gas since the mid-19th century has led to the release of over 1100 GtCO2 into the atmosphere ( IPCC, 2001 [NPR] ). Global CO2 emissions from fuel combustion (around 70% of total GHG emissions and 80% of total CO2) temporarily stabilized after the two oil crises in 1973 and 1979 before growth continued ( Figure 4.6 ). (Emission data can be found at UNFCCC, 2006 [NPR] and EEA, 2005 [NPR, MoS] ). Analyses of potential CO2 reductions for energy-supply options (for example IPCC, 2001 [NPR] ; Sims et al., 2003a [SRC] ; IEA/NEA, 2005; IEA, 2006b [NPR] ) showed that emissions from the energy-supply sector have grown at over 1.5% per year from around 20 GtCO2 (5.5 GtC) in 1990 to over 26 GtCO2 (7 GtC) by 2005 .
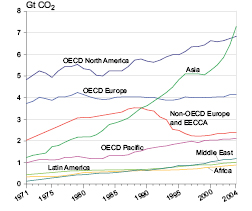
Figure 4.6 : Global trends in carbon dioxide emissions from fuel combustion by region from 1971 to 2004 .
The European Union’s CO2 emissions almost stabilized in this period mainly due to reductions by Germany, Sweden, and UK, but offset by increases by other EU-15 members ( BP, 2004 [NPR] ) such that total CO2 emissions had risen 6.5% by 2004 . Other OECD country emissions increased by 20% during the same period, Brazil by 68%, and Asia by 104%. From 1990 to 2005, China’s CO2 emissions increased from 676 to 1,491 MtCO2/yr to become 18.7% of global emissions ( IEEJ, 2005 [NPR, MoS] ; BP, 2006 [NPR] ) second only to the US. Carbon emissions from non OECD Europe and the FSU dropped by 38% between 1989 and 1999 but have since started to increase as their economies rebound.
Natural gas and nuclear gained an increased market share after the oil crises in the 1970 s and continue to play a role in lowering GHG emissions, along with renewable energy. Continuous technical progress towards non-carbon energy technologies and energy-efficiency improvements leads to an annual decline in carbon intensity. The carbon intensity of global primary energy use declined from 78 gCO2/MJ in 1973 to 61 gCO2/MJ in 2000 ( BP, 2005 [NPR] ) mainly due to diversification of energy supply away from oil. China’s carbon-intensity reduction was around 5%/yr during the period 1980 to 2000 with 3%/yr expected out to 2050 ( Chen, 2005 [MoS, ARC] ), although recent revision of China’s GDP growth for 2004 by government officials may affect this prediction. The US has decreased its GHG intensity (GHG/unit GDP) by 2% in 2003 and 2.5% in 2004 ( Snow, 2006 [NPR] ) although actual emissions rose.
For the power generation and heat supply sector, emissions were 12.7.GtCO2-eq in 2004 (26% of total) including 2.2 GtCO2-eq from methane (31% of total) and traces of N2O ( Chapter 1 ). In 2030, according to the World Energy Outlook 2006 baseline ( IEA, 2006b [NPR] ), these will have increased to 17.7 GtCO2-eq. During combustion of fossil fuels and biomass, nitrous oxide, as well as methane, is produced. Methane emissions from natural gas production, transmission and distribution are uncertain ( UNFCCC, 2004 [NPR] ). The losses to the atmosphere reported to the UNFCCC in 2002 were in the range 0.3–1.6% of the natural gas consumed. For more than a decade, emissions from flaring and venting of the gas associated with oil extraction have remained stable at about 0.3 GtCO2-eq/yr. Developing countries accounted for more than 85% of this emission source ( GGFR, 2004 [NPR] ).
Coal bed methane (CBM, Section 4.3.1.2 ) is naturally contained in coal seams and adjacent rock strata. Unless it is intentionally drained and captured from the coal and rock the process of coal extraction will continue to liberate methane into the atmosphere. Around 10% of total anthropogenic methane emissions in the USA are from this source ( US EPA, 2003 [NPR] ). The 13 major coal-producing countries together produce 85% of worldwide CBM estimated to be 0.24 GtCO2-eq in 2000 . China was the largest emitter (0.1 GtCO2-eq) followed by the USA (0.04 GtCO2-eq), and Ukraine (0.03 GtCO2-eq). Total CBM emissions are expected to exceed 0.3 GtCO2-eq in 2020 ( US EPA, 2003 [NPR] ) unless mitigation projects are implemented.
Other GHGs are produced by the energy sector but in relatively low volumes. SF6 is widely used in high-voltage gas-insulated substations, switches and circuit breakers because of its high di-electric constant and electrical insulating properties ( Section 7.4.8 ). Its 100-year global warming potential (GWP) is 23,900 times that of CO2 and it has a natural lifetime in the atmosphere of 3200 years, making it among the most potent of heat-trapping gases. Approximately 80% of SF6 sales go to power utilities and electric power equipment manufacturers. The US government formed a partnership with 62 electric power generators and utilities (being about 35% of the USA power grid) to voluntarily reduce leakage of SF6 from electrical equipment and the release rate dropped from 17% of stocks to 9% between 1999 and 2002 . This represented a 10% reduction from the 1999 baseline to 0.014 GtCO2-eq ( EPA, 2003 [NPR] ). Australia and the Netherlands also have programmes to reduce SF6 emissions and a voluntary agreement in Norway should lead to 13% reductions by 2005 and 30% by 2010 below their 2000 release rates. CFC-114 is used as a coolant in gaseous diffusion enrichment for nuclear power, but its GHG contribution is small compared to CO2 emissions ( (Dones et al., 2005 ) ).
4.2.3 Regional development trends
World primary energy demand is projected to reach 650–890EJ by 2030 based on A1 and B2 SRES scenarios and the Reference scenario of the IEA’s World Energy Outlook 2004 ( Price and de la Rue du Can, 2006 [NPR, ARC] ). All three scenarios show Asia could surpass North American energy demand by around 2010 and be close to doubling it by 2030 . Africa, the Middle East and Latin America could double their energy demand by 2030; sub-Saharan Africa and the Former Soviet Union may both reach 60–70 EJ, and Pacific OECD and Central and Eastern Europe will be less than 40 EJ each. Demand is more evenly distributed among regions in the B2 scenario, with Central and Eastern Europe and the Pacific OECD region reducing future demand. A similar pattern is evident for final consumer energy ( Table 4.1 ).
Table 4.1: Final energy consumption and carbon dioxide emissions for all sectors by region to 2030 based on assumptions from three baseline scenarios.
| Region | WEO 2004 Reference | SRES A1 Marker | SRES B2 Marker | |||||||||
|---|---|---|---|---|---|---|---|---|---|---|---|---|
| 2002 | 2010 | 2020 | 2030 | 2000 | 2010 | 2020 | 2030 | 2000 | 2010 | 2020 | 2030 | |
| Final energy (EJ) | ||||||||||||
| Pacific OECD | 23.6 | 26.6 | 29.5 | 30.9 | 21.5 | 24.6 | 29.8 | 36.6 | 23.5 | 26.5 | 30.0 | 32.3 |
| Canada/US | 70.2 | 78.3 78.356.7 | 87.4 | 94.6 | 71.3 | 79.3 | 89.8 | 99.2 | 71.0 | 82.4 | 93.3 | 104.1 |
| Europe | 51.5 | 56.7 | 62.3 | 66.5 | 52.0 | 58.9 | 67.6 | 74.6 | 46.9 | 51.3 | 54.4 | 57.9 |
| EIT | 27.0 | 31.0 | 35.9 | 40.5 | 38.4 | 42.6 | 50.1 | 58.8 | 32.0 | 37.5 | 44.8 | 52.7 |
| Latin America | 18.6 | 23.0 | 29.7 | 37.6 | 23.5 | 42.1 | 63.2 | 81.7 | 20.9 | 27.8 | 33.1 | 39.6 |
| Africa/Middle East | 28.4 | 35.4 | 44.8 | 54.3 | 36.4 | 57.2 | 87.6 | 123.7 | 25.6 | 32.6 | 40.2 | 53.1 |
| Asia | 66.8 | 83.1 | 105.3 | 128.3 | 71.5 | 100.6 | 143.9 | 194.6 | 69.4 | 92.5 | 122.0 | 157.5 |
| World | 286.2 | 334.0 | 395.0 | 452.8 | 314.6 | 405.3 | 532.0 | 669.1 | 289.2 | 350.6 | 417.6 | 497.2 |
| Emissions (GtCO2) | ||||||||||||
| Pacific OECD | 2.12 | 2.32 | 2.52 | 2.53 | 2.42 | 2.62 | 2.89 | 3.12 | 2.10 | 2.33 | 2.28 | 2.10 |
| Canada/US | 6.47 | 7.24 | 7.88 | 8.32 | 5.84 | 6.08 | 6.13 | 5.97 | 6.61 | 7.63 | 8.36 | 8.43 |
| Europe | 4.12 | 4.45 | 4.81 | 4.90 | 4.21 | 4.53 | 4.74 | 4.73 | 3.95 | 4.04 | 4.07 | 4.13 |
| EIT | 2.39 | 2.79 | 3.21 | 3.54 | 2.97 | 3.45 | 3.71 | 3.85 | 3.23 | 3.26 | 3.66 | 4.08 |
| Latin America | 1.34 | 1.678 | 2.21 | 2.89 | 1.67 | 3.38 | 4.99 | 6.16 | 1.41 | 1.99 | 2.29 | 2.69 |
| Africa/Middle East | 2.01 | 2.51 | 3.40 | 4.21 | 2.50 | 4.89 | 7.55 | 10.29 | 1.98 | 2.39 | 2.85 | 3.90 |
| Asia | 5.52 | 7.33 | 9.91 | 12.66 | 5.82 | 9.85 | 14.32 | 18.53 | 5.58 | 7.47 | 9.65 | 12.12 |
| Int. marine bunkers | 0.46 | 0.47 | 0.48 | 0.51 | ||||||||
| World | 23.98 | 28.33 | 33.93 | 39.03 | 25.42 | 34.81 | 44.33 | 52.65 | 24.86 | 29.10 | 33.15 | 37.46 |
The World Energy Council projected 2000 data out to 2050 for three selected scenarios with varying population estimates ( WEC, 2004d [NPR] ). The IEA 2003c [NPR, MoS] ) and IPCC SRES scenarios ( Chapter 3 ) did likewise. Implications of sustainable development were that primary energy demands are likely to experience a 40 to 150% increase, with emissions rising to between 48 and 55 GtCO2/yr. This presents difficulties for the energy-supply side to meet energy demand. It requires technical progress and capital provision, and provides challenges for minimizing the environmental consequences and sustainability of the dynamic system. Electricity is expected to grow even more rapidly than primary energy by between 110 and 260% up to 2050, presenting even more challenges in needing to build power production and transmission facilities, mostly in developing countries.
The Asia-Pacific region has almost 30% of proven coal resources but otherwise is highly dependent on imported energy, particularly oil, which is now the largest source of primary commercial energy consumed in the region. In 2003, 82% of imported oil came from the Middle East and the region will continue to depend on OPEC countries. A continuation of China’s rapid annual economic growth of 9.67% from 1990 to 2003 ( CSY, 2005 [NPR] ) will result in continued new energy demand, primary energy consumption having increased steadily since the 1980 s. Energy consumption in 2003 reached 49 EJ. High air pollution in China is directly related to energy consumption, particularly from coal combustion that produces 70% of national particulate emissions, 90% of SO2, 67% of N2O and 70% of CO2 ( BP, 2004 [NPR] ).
Increased use of natural gas has recently occurred throughout the Asian region, although its share of 12% of primary energy remains lower than the 23% and 17% shares in the United States and the European Union, respectively ( BP, 2006 [NPR] ). A liquefied natural gas (LNG) market has recently emerged in the region, dominated by Japan, South Korea and Spain, who together provide about 68% of worldwide trade flows.
Primary energy consumption in the Asia-Pacific region due to continued overall economic growth and increasing transport fuel demand is estimated to increase by 1.0% annually over the period 2002 – 2030 in OECD Asia, 2.6% in China, 2.1% in India, and 2.7% in Indonesia ( IEA, 2004a [NPR] ). This will then account for 42% of the increase in world primary-energy demand. The region could be faced with overall energy resource shortages in the coming decades ( (Komiyama et al., 2005 ) ). Energy security risks are likely to increase and stricter environmental restrictions on fossil fuel consumption could be imposed. Nuclear power ( Section 4.3.2 ), hydropower ( Section 4.3.3.1 ) and other renewables ( Section 4.3.3 ) may play a greater role in electricity generation to meet the ever-rising demand.
For economies in transition (EIT, mainly from the former Soviet Union), the total primary energy consumption in 2000 ( Figure 4.6 ) was only 70% of the 1990 level (Enerdata, 2004 ) and a sharp downturn in GHG emissions resulted. Although increasing more recently, emissions remain some 30% below 1990 levels ( IEA, 2003a [NPR] ; Figure 4.2 ). Despite the economic and political transformations, energy systems in EIT countries are still characterized by overcapacity in electricity production, high dependency on fossil-fuel imports and inefficient use ( IEA, 2003b [NPR] ). Market reforms have been accompanied with the opening of these economies, leading to their integration into the European and global economies. Growth is likely to accelerate faster in those countries that have achieved EU membership ( IEA, 2003b [NPR] ). The total primary-energy consumption of EIT has increased by 2% per year since 2000 and is expected to increase steadily over the next couple of decades as income levels and economic outputs expand, unless energy efficiency manages to stabilize demand.
Latin America, Africa and the Middle East are expected to double their energy demand over the next two to three decades and to retain their shares of global energy demand ( IEA, 2005a [NPR] ; Price and de la Rue du Can, 2006 [NPR, ARC] ). Policies in developing countries aimed at energy-supply security, reducing environmental impacts and encouraging a free market economy ( Section 4.5.1.1 ) may help encourage market efficiency, energy conservation, common oil-reserve storage, investment in resource exploration, implementation of the Clean Development Mechanism (CDM) and international carbon emission trading. International cooperation will continue to play a role in the development of energy resources and improvement of industrial productivity.
4.2.4 Implications of sustainable development and energy access
Analysis from 125 countries indicated that well-being and level of development correlate with the degree of modern energy services consumed per capita in each country ( Bailis et al., 2005 [JoC, MoS] ) ( Figure 4.7 ).
Lack of energy access frustrates the aspirations of many developing countries ( OECD, 2004a [NPR] ). Without improvement, the United Nations’ Millennium Development Goals (MDGs) of halving the proportion of people living on less than a dollar a day by 2015 ( UN, 2000 [NPR] ) will be difficult to meet. Achieving this target implies a need for increased access to electricity and expansion of modern cooking and heating fuels for millions of people in developing countries mainly in South Asia and sub-Saharan Africa ( IEA, 2005a [NPR] ). Historical electricity access rates of 40 million people per annum in the 1980 s and 30 million per annum in the 1990 s suggest that current efforts to achieve the MDGs will need to be greatly exceeded. By 2030, around 2400 GW of new power plant capacity will be needed in developing countries (100 GW/yr), which, together with the necessary infrastructure, will require around 5 trillion US$ investment ( IEA, 2006b [NPR] ).
Ecological implications of energy supply result from coal and uranium mining, oil extraction, oil and gas transport, deforestation, erosion and river-flow disturbance. Certain synergetic effects can be achieved between renewable energy generation and ecological values such as reforestation and landscape structural improvements, but these are relatively minor.
4.3 Primary energy resource potentials, supply chain and conversion technologies
This section discusses primary-supply and secondary-energy (carrier) technologies. Technologies that have developed little since the TAR are covered in detail elsewhere (e.g., IEA, 2006a [NPR] ). Energy flows proceed from primary sources through carriers to provide services for end-users ( Figure 4.3 ). The status of energy sources and carriers is reviewed here along with their available resource potential and usage, conversion technologies, costs and environmental impacts. An analysis is made of the potential contributions due to further technological development for each resource to meet the world’s growing energy needs, but also to reduce atmospheric GHG emissions. Assessments of global energy reserves, resources and fluxes, together with cost ranges and sustainability issues, are summarized in Table 4.2 .
Table 4.2: Generalized data for global energy resources (including potential reserves), annual rate of use (490 EJ in 2005 ), share of primary energy supply and comments on associated environmental impacts.
| Energy class | Specific energy sourcea | Estimated available energy resourceb (EJ) | Rate of use in 2005 (EJ/yr)c | 2005 share of total supply (%) | Comments on environmental impacts |
|---|---|---|---|---|---|
| Fossil energy | Coal (conventional) | >100,000 | 120 | 25 | Average 92.0 gCO2/MJ |
| Coal (unconventional) | 32,000 | 0 | |||
| Peatd | large | 0.2 | <0.1 | ||
| Gas (conventional) | 13,500 | 100 | 21 | Average 52.4 gCO2/MJ | |
| Gas (unconventional) | 18,000 | Small | Unknown, likely higher | ||
| Coalbed methane | >8,000? | 1.5 | 0.3 | ||
| Tight sands | 8,000 | 3.3 | 0.7 | ||
| Hydrates | >60,000 | 0 | |||
| Oil (conventional) | 10,000 | 160 | 33 | Average 76.3 gCO2/MJ | |
| Oil (unconventional) | 35,000 | 3 | 0.6 | Unknown, likely higher | |
| Nuclear | Uraniume | 7,400 | 26 | 5.3 | Spent fuel disposition |
| Uranium recyclef | 220,000 | Very small | Waste disposal | ||
| Fusion | 5 x 10⁹ estimated | 0 | Tritium handling | ||
| Renewableg | Hydro (>10 MW) | 60 /yr | 25 | 5.1 | Land-use impacts |
| Hydro (< 10 MW) | 2 /yr | 0.8 | 0.2 | ||
| Wind | 600 /yr | 0.95 | 0.2 | ||
| Biomass (modern) | 250 /yr | 9 | 1.8 | Likely land-use for crops | |
| Biomass (traditional) | 37 | 7.6 | Air pollution | ||
| Geothermal | 5,000 /yr | 2 | 0.4 | Waterway contamination | |
| Solar PV | 1,600 /yr | 0.2 | <0.1 | Toxics in manufacturing | |
| Concentrating solar | 50 /yrh | 0.03 | 0.1 | Small | |
| Ocean (all sources) | 7/yr (exploitable) | <1 | 0 | Land and coastal issues. |
4.3.1 Fossil fuels
Fossil energy resources remain abundant but contain significant amounts of carbon that are normally released during combustion. The proven and probable reserves of oil and gas are enough to last for decades and in the case of coal, centuries (Table. 4.2). Possible undiscovered resources extend these projections even further.
Fossil fuels supplied 80% of world primary energy demand in 2004 ( IEA, 2006b [NPR] ) and their use is expected to grow in absolute terms over the next 20–30 years in the absence of policies to promote low-carbon emission sources. Excluding traditional biomass, the largest constituent was oil (35%), then coal (25%) and gas (21%) ( BP, 2005 [NPR] ). In 2003 alone, world oil consumption increased by 3.4%, gas by 3.3% and coal by 6.3% ( WEC, 2004a [NPR] ). Oil accounted for 95% of the land-, water- and air-transport sector demand ( IEA, 2005d [NPR, MoS] ) and, since there is no evidence of saturation in the market for transportation services ( WEC, 2004a [NPR] ), this percentage is projected to rise ( IEA, 2003c [NPR, MoS] IEA 2005b [NPR] ) projected that oil demand will grow between 2002 and 2030 (by 44% in absolute terms), gas demand will almost double, and CO2 emissions will increase by 62% (which lies between the SRES A1 and B2 scenario estimates of +101% and +55%, respectively; Table 4.1 ).
Fossil energy use is responsible for about 85% of the anthropogenic CO2 emissions produced annually ( IEA, 2003d [NPR] ). Natural gas is the fossil fuel that produces the lowest amount of GHG per unit of energy consumed and is therefore favoured in mitigation strategies. Fossil fuels have enjoyed economic advantages that other technologies may not be able to overcome, although there has been a recent trend for fossil fuel prices to increase and renewable energy prices to decrease because of continued productivity improvements and economies of scale. All fossil fuel options will continue to be used if matters are left solely to the market place to determine choice of energy conversion technologies. If GHGs are to be reduced significantly, either current uses of fossil energy will have to shift toward low- and zero-carbon sources, and/or technologies will have to be adopted that capture and store the CO2 emissions. The development and implementation of low-carbon technologies and deployment on a larger scale requires considerable investment, which, however, should be compared with overall high investments in future energy infrastructure (see Section 4.1 ).
4.3.1.1 Coal and peat
Coal is the world’s most abundant fossil fuel and continues to be a vital resource in many countries ( IEA, 2003e [NPR] ). In 2005, coal accounted for around 25% of total world energy consumption primarily in the electricity and industrial sectors ( BP, 2005 [NPR] ; US EIA, 2005 [NPR, MoS] ; Enerdata, 2004 ). Global proven recoverable reserves of coal are about 22,000 EJ ( BP, 2004 [NPR] ; WEC, 2004b [NPR] ) with another 11,000 EJ of probable reserves and an estimated additional possible resource of 100,000 EJ for all types. Although coal deposits are widely distributed, over half of the world’s recoverable reserves are located in the US (27%), Russia (17%) and China (13%). India, Australia, South Africa, Ukraine, Kazakhstan and the former Yugoslavia account for an additional 33% ( US DOE, 2005 [NPR] ). Two thirds of the proven reserves are hard coal (anthracite and bituminous) and the remainder are sub-bituminous and lignite. Together these resources represent stores of over 12,800 GtCO2. Consumption was around 120 EJ/yr in 2005, which introduced approximately 9.2 GtCO2/yr into the atmosphere.
Peat (partially decayed plant matter together with minerals) has been used as a fuel for thousands of years, particularly in Northern Europe. In Finland, it provides 7% of electricity and 19% of district heating.
Technologies
The demand for coal is expected to more than double by 2030 and the IEA has estimated that more than 4500 GW of new power plants (half in developing countries) will be required in this period ( IEA, 2004a [NPR] ). The implementation of modern high-efficiency and clean utilization coal technologies is key to the development of economies if effects on society and environment are to be minimized ( Section 4.5.4 ).
Most installed coal-fired electricity-generating plants are of a conventional subcritical pulverized fuel design, with typical efficiencies of about 35% for the more modern units. Supercritical steam plants are in commercial use in many developed countries and are being installed in greater numbers in developing countries such as China ( Philibert and Podkanski, 2005 [NPR] ). Current supercritical technologies employ steam temperatures of up to 600ºC and pressures of 280 bar delivering fuel to electricity-cycle efficiencies of about 42% ( Moore, 2005 [Ambiguous] ). Conversion efficiencies of almost 50% are possible in the best supercritical plants, but are more costly (Equitech, 2005; IPCC, 2001 [NPR] ; Danish Energy Authority, 2005 ). Improved efficiencies have reduced the amount of waste heat and CO2 that would otherwise have been emitted per unit of electricity generation.
Technologies have changed little since the TAR. Supercritical plants are now built to an international standard, however, and a CSIRO 2005 [NPR] ) project is under way to investigate the production of ultra-clean coal that reduces ash below 0.25%, sulphur to low levels and, with combined-cycle direct-fired turbines, can reduce GHG emissions by 24% per kWh, compared with conventional coal power stations.
Gasifying coal prior to conversion to heat reduces the emissions of sulphur, nitrogen oxides, and mercury, resulting in a much cleaner fuel while reducing the cost of capturing CO2 emissions from the flue gas where that is conducted. Continued development of conventional combustion integrated gasification combined cycle (IGCC) systems is expected to further reduce emissions.
Coal-to-liquids (CTL) is well understood and regaining interest, but will increase GHG emissions significantly without CCS ( Section 4.3.6 ). Liquefaction can be performed by direct solvent extraction and hydrogenation of the resulting liquid at up to 67% efficiency ( DTI, 1999 [NPR] ) or indirectly by gasification then producing liquids by Fischer-Tropsch catalytic synthesis as in the three SASOL plants in South Africa. These produce 0.15 Mbbl/day of synthetic diesel fuel (80%) plus naphtha (20%) at 37–50% thermal efficiency. Lower-quality coals would reduce the thermal efficiency whereas co-production with electricity and heat (at a 1:8 ratio) could increase it and reduce the liquid fuel costs by around 10%.
Production costs of CTL appear competitive when crude oil is around 35–45 US$/bbl, assuming a coal price of 1 US$/GJ. Converting lignite at 0.50 US$/GJ close to the mine could compete with production costs of about 30 US$/bbl. The CTL process is less sensitive to feedstock prices than the gas-to-liquids (GTL) process, but the capital costs are much higher ( IEA, 2005e [NPR, MoS] ). An 80,000 barrel per day CTL installation would cost about 5 billion US$ and would need at least 2–4 Gt of coal reserves available to be viable.
4.3.1.2 Gaseous fuels
Conventional natural gas
Natural gas production has been increasing in the Middle East and Asia–Oceania regions since the 1980 s. Globally, from 1994 – 2004, it showed an annual growth rate of 2.3%. During 2005, 11% of natural gas was produced in the Middle East, while Europe and Eurasia produced 38%, and North America 27% ( BP, 2006 [NPR] ). Natural gas presently accounts for 21% of global consumption of modern energy at around 100 EJ/yr, contributing around 5.5 GtCO2 annually to the atmosphere.
Proven global reserves of natural gas are estimated to be 6500 EJ ( BP, 2006 [NPR] ; WEC, 2004c [NPR] ; USGS, 2004b [NPR] ). Almost three quarters are located in the Middle East, and the transitional economies of the FSU and Eastern Europe. Russia, Iran and Qatar together account for about 56% of gas reserves, whereas the remaining reserves are more evenly distributed on a regional basis including North Africa ( BP, 2006 [NPR] ). Probable reserves and possible undiscovered resources that expect to be added over the next 25 years account for 2500 EJ and 4500 EJ respectively ( USGS, 2004a [NPR] ), although other estimates are less optimistic.
Natural gas-fired power generation has grown rapidly since the 1980 s because it is relatively superior to other fossil-fuel technologies in terms of investment costs, fuel efficiency, operating flexibility, rapid deployment and environmental benefits, especially when fuel costs were relatively low. Combined cycle, gas turbine (CCGT) plants produce less CO2 per unit energy output than coal or oil technologies because of the higher hydrogen-carbon ratio of methane and the relatively high thermal efficiency of the technology. A large number of CCGT plants currently being planned, built, or operating are in the 100–500 MWe size range. Advanced gas turbines currently under development, such as so-called ‘H’ designs, may have efficiencies approaching 60% using high combustion temperatures, steam-cooled turbine blades and more complex steam cycles.
Despite rising prices, natural gas is forecast to continue to be the fastest-growing primary fossil fuel energy source worldwide ( IEA, 2006b [NPR] ), maintaining average growth of 2.0% annually and rising to 161 EJ consumption in 2025 . The industrial sector is projected to account for nearly 23% of global natural gas demand in 2030, with a similar amount used to supply new and replacement electric power generation. The share of natural gas used to generate electricity worldwide is projected to increase from 25% of primary energy in 2004 to 31% in 2030 ( IEA, 2006b [NPR] ).
LNG
Meeting future increases in global natural gas demand for direct use by the industrial and commercial sectors as well as for power generation will require development and scale-up of liquefied natural gas (LNG) as an energy carrier. LNG transportation already accounts for 26% of total international natural gas trade in 2002, or about 6% of world natural gas consumption and is expected to increase substantially.
The Pacific Basin is the largest LNG-producing region in the world, supplying around 50% of all global exports in 2002 ( US EIA, 2005 [NPR, MoS] ). The share of total US natural gas consumption met by net imports of LNG is expected to grow from about 1% in 2002 to 15% (4.5 EJ) in 2015 and to over 20% (6.8 EJ) in 2025 . Losses during the LNG liquefaction process are estimated to be 7 to 13% of the energy content of the withdrawn natural gas being larger than the typical loss of pipeline transportation over 2000 km.
LPG
Liquefied petroleum gas (LPG) is a mixture of propane, butane, and other hydrocarbons produced as a by-product of natural gas processing and crude oil refining. Total global consumption of LPG amounted to over 10 EJ in 2004 (MCH/WLPGA, 2005 ), equivalent to 10% of global natural gas consumption ( (Venn, 2005 ) ). Growth is likely to be modest with current share maintained.
Unconventional natural gas
Methane stored in a variety of geologically complex, unconventional reservoirs, such as tight gas sands, fractured shales, coal beds and hydrates, is more abundant than conventional gas ( Table 4.2 ). Development and distribution of these unconventional gas resources remain limited worldwide, but there is growing interest in selected tight gas sands and coal-bed methane (CBM). Probable CBM resources in the US alone are estimated to be almost 800 EJ but less than 110 EJ is believed to be economically recoverable ( USGS, 2004b [NPR] ) unless gas prices rise significantly. Worldwide resources may be larger than 8000 EJ, but a scarcity of basic information on the gas content of coal resources makes this number highly speculative.
Large quantities of tight gas are known to exist in geologically complex formations with low permeability, particularly in the US, where most exploration and production has been undertaken. However, only a small percentage is economically viable with existing technology and current US annual production has stabilized between 2.7 and 3.8 EJ.
Methane gas hydrates occur naturally in abundance worldwide and are stable as deep marine sediments on the ocean floor at depths greater than 300m and in polar permafrost regions at shallower depths. The amount of carbon bound in hydrates is not well understood, but is estimated to be twice as large as in all other known fossil fuels ( USGS, 2004a [NPR] ). Hydrates may provide an enormous resource with estimates varying from 60,000 EJ ( USGS, 2004a [NPR] ) to 800,000 EJ (Encyclopedia of Energy,) to 800,000 EJ (Encyclopedia of Energy,). Recovering the methane is difficult, however, and represents a significant environmental problem if unintentionally released to the atmosphere during extraction. Safe and economic extraction technologies are yet to be developed ( USGS, 2004a [NPR] ). Hydrates also contain high levels of CO2 that may have to be captured to produce pipeline-quality gas (Encyclopedia of Energy, that may have to be captured to produce pipeline-quality gas (Encyclopedia of Energy,).
The GTL process is gaining renewed interest due to higher oil prices, particularly for developing uneconomic natural gas reserves such as those associated with oil extraction at isolated gas fields which lie far from markets. As for CTL, the natural gas is turned into synthesis gas, which is converted by the Fischer-Tropsch process to synthetic fuels. At present, at least nine commercial GTL projects are progressing through various development stages in gas-rich countries such as Qatar, Iran, Russia, Nigeria, Australia, Malaysia and Algeria with worldwide production estimated at 0.58 Mbbl/day (FACTS, 2005 ). GTL conversion technologies are around 55% efficient and can help bring some of the estimated 6000 EJ of stranded gas resources to market. Production costs vary depending on gas prices, but where stranded gas is available at 0.5 US$/GJ production costs are around 30 US$ a barrel ( IEA 2006a [NPR] ). Higher CO2 emissions per unit consumed compared with conventional oil products.
4.3.1.3 Petroleum fuels
Conventional oil products extracted from crude oil-well bores and processed by primary, secondary or tertiary methods represent about 37% of total world energy consumption ( Figure 4.4 and Table 4.2 ) with major resources concentrated in relatively few countries. Two thirds of proven crude oil reserves are located in the Middle East and North Africa ( IEA, 2005a [NPR] ).
Known or proven reserves are those extractable at today’s prices and technologies. Additional probable and possible resources are based on historical experience in geological basins. While new discoveries have lagged behind production for more than 20 years, reserve additions from all sources including discoveries, extensions, revisions and improvements in oil recovery continue to outpace production ( IEA, 2005b [NPR] ).
Various studies and models have been used to forecast future oil production ( US EIA, 2004 [NPR] ; Bentley, 2005 [NPR] ). Geological models take into consideration the volume and quality of hydrocarbons but do not include economic effects on price, which in turn has a direct effect on supply and the overall rate of recovery. Mathematical models generally use the historical as well as the observed patterns of production to estimate a peak (or several peaks) reached when half the reserves are consumed.
Assessments of the amount of oil consumed, the amount remaining for extraction, and whether the peak oil tipping point is close or not, have been very controversial ( Hirsch et al., 2005 [NPR] ). Estimates of the ultimate extractable resource (proven + probable + possible reserves) with which the world was endowed have varied from less than 5730 EJ to 34,000 EJ ( 1000 to 6000 Gbbl), though the more recent predictions have all ranged between 11,500–17,000 EJ ( 2000 –3000 Gbbl) ( Figure 4.8 ). Over time, the prediction trend showed increasing resource estimates in the 1940 s and 1950 s as more fields were discovered. However, the very optimistic estimates of the 1970 s were later discredited and a relatively constant estimate has since been observed.
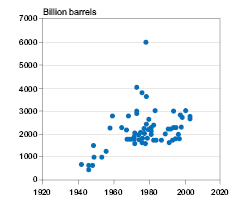
Figure 4.8: Estimates of the global ultimate extractable conventional oil resource by year of publications.
Specific analyses include ( Bentley 2002b ) ), who concluded that 4870 EJ had been consumed by 1998 and that 6300 EJ will have been extracted by 2008 . The US Geological Survey ( USGS, 2000 [NPR] ) the World Petroleum Congress and the IFP agreed that approximately 4580 EJ (800 Gbbl) have been consumed in the past 150 years and 5730 EJ ( 1000 Gbbl) of proven reserves remain. Other detailed analyses (e.g. USGS, 2000 [NPR] ) also estimated there are 4150 EJ of probable and possible resources still available for extraction. Thus, the total available potential proven reserves plus resources of around 10,000 EJ ( BP, 2004 [NPR] ; WEC, 2004b [NPR] ) should be sufficient for about 70 years’ supply at present rates of consumption. Since consumption rates will continue to rise, however, 30 to 40 years’ supply is a more reasonable estimate ( Hallock et al., 2004 [MoS] ). Burning this amount of petroleum resources would release approximately 700 GtCO2 (200 GtC) into the atmosphere, about two thirds the amount released to date from all fossil-fuel consumption. Opportunities for energy-efficiency improvements in oil refineries and associated chemical plants are covered in Chapter 7 .
4.3.1.4 Unconventional oil
As conventional oil supplies become scarce and extraction costs increase, unconventional liquid fuels, in addition to CTL and GTL, will become more economically attractive, but offset by greater environmental costs ( Williams et al., 2006 [NPR] ). Oil that requires extra processing such as from shales, heavy oils and oil (tar) sands is classified as unconventional. Resource estimates are uncertain, but together contributed around 3% of world oil production in 2005 (2.8 EJ) and could reach 4.6 EJ by 2020 ( USGS, 2000 [NPR] ) and up to 6 EJ by 2030 ( IEA, 2005a [NPR] ). The oil industry has the potential to diversify the product mix, thereby adding to fuel-supply security, but higher environmental impacts may result and investment in new infrastructure would be needed.
Heavy oil reserves are greater than 6870 EJ ( 1200 Gbbl) of oil equivalent with around 1550 EJ technically recoverable. The Orinoco Delta, Venezuela has a total resource of 1500 EJ with current production of 1.2 EJ/yr ( WEC, 2004c [NPR] ). Plans for 2009 are to apply deep-conversion, delayed coking technology to produce 0.6 Mbbl/day of high-value transport fuels.
Oil shales (kerogen that has not completed the full geological conversion to oil due to insufficient heat and pressure) represent a potential resource of 20,000 EJ with a current production of just 0.024 EJ/yr, mostly in the US, Brazil, China and Estonia. Around 80% of the total resource lies in the western US with 500 Gbbl of medium-quality reserves from rocks yielding 95 L of oil per tonne but with 1000 Gbbl potential if utilizing lower-quality rock. Mining and upgrading of oil shale to syncrude fuel costs around 11 US$/bbl. As with oil sands (below), the availability of abundant water is an issue.
Around 80% of the known global tar sand resource of 15,000 EJ is in Alberta, Canada, which has a current production of 1.6 EJ/yr, representing around 15% of national oil demand. Around 310 Gbbl is recoverable ( CAPP, 2006 [NPR] ). Production of around 2 Mbbl/day by 2010 could provide more than half of Canada’s projected total oil production with 4 Mbbl/day possible by 2020 . Total resources represent at least 400 Gt of stored carbon and will probably be added to as more are discovered, assuming that natural gas and water (steam) to extract the hydrocarbons are available at a reasonable cost.
Technologies for recovering tar sands include open cast (surface) mining where the deposits are shallow enough (which accounts for 10% of the resource but 80% of current extraction), or injection of steam into wells in situ to reduce the viscosity of the oil prior to extraction. Mining requires over 100m3 of natural gas per barrel of bitumen extracted and in situ around 25m3. In both cases cleaning and upgrading to a level suitable for refining consumes a further 25–50m3 per barrel of oil feedstock. The mining process uses about four litres of water to produce one litre of oil but produces a refinable product. The in situ process uses about two litres of water to one of oil, but the very heavy product needs cleaning and diluting (usually with naptha) at the refinery or sent to an upgrader to yield syncrude at an energy efficiency of around 75% ( NEB, 2006 [NPR] ). The energy efficiency of oil sand upgrading is around 75%. Mining, producing and upgrading oil sands presently costs about 15 US$/bbl ( IEA, 2006a [NPR] ) but new greenfield projects would cost around 30–35 US$/bbl due to project-cost inflation in recent years ( NEB, 2006 [NPR] ). If CCS is integrated, then an additional 5 US$ per barrel at least should be added. Comparable costs for conventional oil are 4–6 US$/bbl for exploration and production and 1–2 US$/bbl for refining.
Mining of oil sands leaves behind large quantities of pollutants and areas of disturbed land.
The total CO2 emitted per unit of energy during production of liquid unconventional oils is greater than for a unit of conventional oil products due to higher energy inputs for extraction and processing. Net emissions amount to 15–34 kgCO2 (4–9 kgC) per GJ of transport fuel compared with around 5-10 kgCO2 (1.3-2.7 kgC) per GJ for conventional oil ( IEA, 2005d [NPR, MoS] , Woyllinowicz et al., 2005 [NPR] ). Oil sands currently produce around 3–4 times the pre-combustion emissions (CO2/GJ liquid fuel) compared with conventional oil extraction and refining, whereas large-scale production of oil-shale processing would be about 5 times, GTL 3–4 times, and CTL around 7–8 times when using sub-bituminous coal. The Athabascan oil-sands project has refining energy expenditures of 1 GJ energy input per 6 GJ bitumen processed, producing emissions of 11 kgCO2 (3 kgC) per GJ from refining alone, but with a voluntary reduction goal of 50% by 2010 (Shell, 2006 ).
4.3.2 Nuclear energy
In 2005, 2626 TWh of electricity (16% of the world total) was generated by nuclear power, requiring about 65,500 t of natural uranium ( WNA, 2006a [NPR] ). As of December 2006, 442 nuclear power plants were in operation with a total installed capacity of about 370 GWe ( WNA, 2006a [NPR] ). Six plants were in long-term shutdown and since 2000, the construction of 21 new reactors has begun ( IAEA, 2006 [NPR] ). The US has the largest number of reactors and France the highest percentage hare of total electricity generation. Many more reactors are either planned or proposed, mostly in China, India, Japan, Korea, Russia, South Africa and the US ( WNA, 2006a [NPR] ). Nuclear power capacity forecasts out to 2030 ( IAEA, 2005c [NPR, MoS] ; WNA, 2005a [NPR] ; Maeda, 2005 [NPR] ; Nuclear News, 2005 [MoS] ) vary between 279 and 740 GWe when proposed new plants and the decommissioning of old plants are both considered. In Japan 55 nuclear reactors currently provide nearly a third of total national electricity with one to be shut down in 2010 . Immediate plans for construction of new reactors have been scaled down due to anticipated reduced power demand due to greater efficiency and population decline ( METI, 2005 [NPR] ). The Japanese target is now to expand the current installed 50 GWe to 61 GWe by adding 13 new reactors with nine operating by 2015 to provide around 40% of total electricity ( JAEC, 2005 [NPR] ). In China there are nine reactors in operation, two under construction and proposals for between 28 and 40 new ones by 2020 ( WNA, 2006b [NPR] ; IAEA, 2006 [NPR] ) giving a total capacity of 41–46 GWe (Dellero & Chessé, 2006 [NotFound] ). To meet future fuel demand, China has ratified a safeguards agreement ( ANSTO, 2006 [NPR] ) enabling the future purchase of thousands of tonnes of uranium from Australia, which has 40% of the world’s reserves. In India seven reactors are under construction, with plans for 16 more to give 20 GWe of nuclear capacity installed by 2020 ( Mago, 2004 [NPR] ).
Improved safety and economics are objectives of new designs of reactors. The worldwide operational performance has improved and the 2003 – 2005 average unit capacity factor was 83.3% ( IAEA, 2006 [NPR] ). The average capacity factors in the US increased from less than 60% to 90.9% between 1980 and 2005, while average marginal electricity-production costs (operation, maintenance and fuel costs) declined from 33 US$/MWh in 1988 to 17 US$/MWh in 2005 ( NEI, 2006 [NPR] ).
The economic competitiveness of nuclear power depends on plant-specific features, number of plants previously built, annual hours of operation and local circumstances. Full life-cycle cost analyses have been used to compare nuclear-generation costs with coal, gas or renewable systems ( Section 4.4.2 ; Figure 4.27 ) (IEA/NEA, 2005 ) including:
- investment (around 45–70% of total generation costs for design, construction, refurbishing, decommissioning and expense schedule during the construction period);
- operation and maintenance (around 15–40% for operating and support staff, training, security, and periodic maintenance); and
- fuel cycle (around 10–20% for purchasing, converting and enriching uranium, fuel fabrication, spent fuel conditioning, reprocessing, transport and disposal of the spent fuel).
Decommissioning costs are below 500 US$/kW (undiscounted) for water reactors ( OECD, 2003 [NPR] ) but around 2500 US$/kW for gas-cooled (e.g. Magnox) reactors due to radioactive waste volumes normalized by power output being about ten times higher. The decommissioning and clean-up of the entire UK Sellafield site, including facilities not related to commercial nuclear power production, has been estimated to cost £31.8 billion or approximately 60 billion US$ ( NDA, 2006 [NPR] ).
Total life-cycle GHG emissions per unit of electricity produced from nuclear power are below 40 gCO2-eq/kWh (10 gC-eq/kWh), similar to those for renewable energy sources ( Figure 4.18 ( WEC, 2004a [NPR] ; Vattenfall, 2005 ). Nuclear power is therefore an effective GHG mitigation option, especially through license extensions of existing plants enabling investments in retro-fitting and upgrading. Nuclear power currently avoids approximately 2.2–2.6 GtCO2/yr if that power were instead produced from coal ( WNA, 2003 [NPR] ; Rogner, 2003 [NPR, ARC] ) or 1.5 GtCO2/yr if using the world average CO2 emissions for electricity production in 2000 of 540 gCO2/kWh ( WEC, 2001 [NPR] ). However, Storm van Leeuwen and Smith 2005 [NPR, ARC] ) give much higher figures for the GHG emissions from ore processing and construction and decommissioning of nuclear power plants.
4.3.2.1 Risks and environmental impacts
Regulations demand that public and occupational radiation doses from the operation of nuclear facilities be kept as low as reasonably achievable and below statutory limits. Mining, milling, power-plant operation and reprocessing of spent fuel dominate the collective radiation doses ( OECD, 2000 [NPR] ). Protective actions for mill-tailing piles and ponds have been demonstrated to be effective when applied to prevent or reduce long-term impacts from radon emanation. In the framework of the IAEA’s Nuclear Safety Convention ( IAEA, 1994 [NPR] ), the IAEA member countries have agreed to maintain high safety culture to continuously improve the safety of nuclear facilities. However, risks of radiation leakage resulting from accidents at a power plant or during the transport of spent fuel remain controversial.
Operators of nuclear power plants are usually liable for any damage to third parties caused by an incident at their installation regardless of fault ( UIC, 2005 [NPR] ), as defined by both international conventions and national legislation. In 2004, the contracting parties to the OECD Paris and Brussels Conventions signed Amending Protocols setting the minimum liability limit at 700 million € with additional compensation up to 800 € through public funds. Many non-OECD countries have similar arrangements through the IAEA’s Vienna Convention. In the US, the national Price-Anderson Act provides compensation up to 300 million US$ covered by an insurance paid by each reactor and also by a reactor-operator pool from the 104 reactors, which provides 10.4 billion US$.
4.3.2.2 Nuclear-waste management, disposal and proliferation aspects
The main safety objective of nuclear waste management ( IAEA, 1997 [NPR] ; IAEA, 2005b [NPR] ) is that human health and the environment need to be protected now and in the future without imposing undue burdens on future generations. Repositories are in operation for the disposal of low- and medium-level radioactive wastes in several countries but none yet exist for high-level waste (HLW) such as spent light-water reactor (LWR) fuel. Deep geological repositories are the most extensively studied option but resolution of both technical and political/societal issues is still needed.
In 2001, the Finnish Parliament agreed to site a spent fuel repository near the Olkiluoto nuclear power plant. After detailed rock-characterization studies, construction is scheduled to start soon after 2010 with commissioning planned for around 2020 . In Sweden, a repository-siting process is concentrating on the comparison of several site alternatives close to the Oskarshamn and Forsmark nuclear power plants. In the US, the Yucca Mountain area has been chosen, amidst much controversy, as the preferred site for a HLW repository and extensive site-characterization and design studies are underway, although not without significant opposition. It is not expected to begin accepting HLW before 2015 . France is also progressing on deep geological disposal as the reference solution for long-lived radioactive HLW and sets 2015 as the target date for licensing a repository and 2025 for opening it ( DGEMP, 2006 [NPR] ). Spent-fuel reprocessing and recycling of separate actinides would significantly reduce the volume and radionuclide inventory of HLW.
The enrichment of uranium (U-235), reprocessing of spent fuel and plutonium separation are critical steps for nuclear-weapons proliferation. The Treaty on Non-Proliferation of Nuclear Weapons (NPT) has been ratified by nearly 190 countries. Compliance with the terms of the NPT is verified and monitored by the IAEA. Improving proliferation resistance is a key objective in the development of next-generation nuclear reactors and associated advanced fuel-cycle technologies. For once-through uranium systems, stocks of plutonium are continuously built up in the spent fuel, but only become accessible if reprocessed. Recycling through fast-spectrum reactors on the other hand allows most of this material to be burned up in the reactor to generate more power, although there are vulnerabilities in the reprocessing step and hence still the need for careful safeguards. Advanced reprocessing and partitioning and transmutation technologies could minimize the volumes and toxicity of wastes for geological disposal, yet uncertainties about proliferation-risk and cost remain.
4.3.2.3 Development of future nuclear-power systems
Present designs of reactors are classed as Generations I through III ( Figure 4.9 ). Generation III+ advanced reactors are now being planned and could first become operational during the period 2010 – 2020 ( GIF, 2002 [NPR] ) and state-of-the-art thereafter to meet anticipated growth in demand. These evolutionary reactor designs claim to have improved economics, simpler safety systems with the impacts of severe accidents limited to the close vicinity of the reactor site. Examples include the European design of a pressurized water reactor (EPR) scheduled to be operating in Finland around 2010 and the Flamanville 3 reactor planned in France.
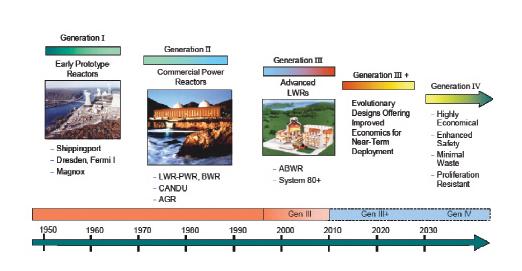
Figure 4.9: Evolution of nuclear power systems from Generation I commercial reactors in the 1950 s up to the future Generation IV systems which could be operational after about 2030 .
Generation IV nuclear-energy technologies that may become operational after about 2030 employ advanced closed-fuel cycle systems with more efficient use of uranium and thorium resources. Advanced designs are being pursued mainly by the Generation-IV International Forum (GIF, a group of ten nations plus the EU and coordinated by the US Department of Energy) as well as the International Project on Innovative Nuclear Reactors and Fuel Cycles (INPRO) coordinated by the IAEA. The Global Nuclear Energy Partnership ( US DOE, 2006 [NPR] ), proposed by the US, has similar objectives. These initiatives focus on the development of reactors and fuel cycles that provide economically competitive, safe and environmentally sound energy services based on technology designs that exclude severe accidents, involve proliferation-resistant fuel cycles decoupled from any fuel-resource constraints, and minimize HLW. Much additional technology development would be needed to meet these long-term goals so strategic public RD&D funding is required, since there is limited industrial/commercial interest at this early stage.
GIF has developed a framework to plan and conduct international cooperative research on advanced (breeder or burner) nuclear-energy systems ( GIF, 2002 [NPR] ) including three designs of fast-neutron reactor, (sodium-cooled, gas-cooled and lead-cooled) as well as high-temperature reactors. Reactor concepts capable of producing high-temperature nuclear heat are intended to be employed also for hydrogen generation, either by electrolysis or directly by special thermo-chemical water-splitting processes or steam reforming. There is also an ongoing development project by the South African utility ESKOM for an innovative high-temperature, pebble-bed modular reactor. Specific features include its smaller unit size, modularity, improved safety by use of passive features, lower power production costs and the direct gas-cycle design utilizing the Brayton cycle ( Koster et al., 2003 [MoS] ; NER, 2004 [NPR] ). The supercritical light-water reactor is also one of the GIF concepts intended to be operated under supercritical water pressure and temperature conditions. Conceivably, some of these concepts may come into practical use and offer better prospects for future use of nuclear power.
Experience of the past three decades has shown that nuclear power can be beneficial if employed carefully, but can cause great problems if not. It has the potential for an expanded role as a cost-effective mitigation option, but the problems of potential reactor accidents, nuclear waste management and disposal and nuclear weapon proliferation will still be constraining factors.
4.3.2.4 Uranium exploration, extraction and refining
In the long term, the potential of nuclear power is dependent upon the uranium resources available. Reserve estimates of the uranium resource vary with assumptions for its use ( Figure 4.10 ). Used in typical light-water reactors (LWR) the identified resources of 4.7 Mt uranium, at prices up to 130 US$/kg, correspond to about 2400 EJ of primary energy and should be sufficient for about 100 years’ supply ( OECD, 2006b [NPR] ) at the 2004 level of consumption. The total conventional proven (identified) and probable (yet undiscovered) uranium resources are about 14.8 Mt (7400 EJ). There are also unconventional uranium resources such as those contained in phosphate minerals, which are recoverable for between 60 and 100 US$/kg ( OECD, 2004a [NPR] ).
If used in present reactor designs with a ‘once-through’ fuel cycle, only a small percentage of the energy content is utilized from the fissile isotope U-235 (0.7% in natural uranium). Uranium reserves would last only a few hundred years at current rate of consumption ( Figure 4.10 ). With fast-spectrum reactors operated in a ‘closed’ fuel cycle by reprocessing the spent fuel and extracting the unused uranium and plutonium produced, the reserves of natural uranium may be extended to several thousand years at current consumption levels. In the recycle option, fast-spectrum reactors utilize depleted uranium and only plutonium is recycled so that the uranium-resource efficiency is increased by a factor of 30 ( Figure 4.10 OECD, 2001 [NPR] ). Thereby the estimated enhanced resource availability of total conventional uranium resources corresponds to about 220,000 EJ primary energy ( Table 4.2 ). Even if the nuclear industry expands significantly, sufficient fuel is available for centuries. If advanced breeder reactors could be designed in the future to efficiently utilize recycled or depleted uranium and all actinides, then the resource utilization efficiency would be further improved by an additional factor of eight ( OECD, 2006c [NPR] ).
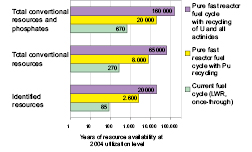
Figure 4.10: Estimated years of uranium-resource availability for various nuclear technologies at 2004 nuclear-power utilization levels.
Nuclear fuels could also be based on thorium with proven and probable resources being about 4.5 Mt ( OECD, 2004a [NPR] ). Thorium-based fast-spectrum reactors appear capable of at least doubling the effective resource base, but the technology remains to be developed to ascertain its commercial feasibility ( IAEA, 2005a [NPR] ). There are not yet sufficient commercial incentives for thorium-based reactors except perhaps in India. The thorium fuel cycle is claimed to be more proliferation-resistant than other fuel cycles since it produces fissionable U-233 instead of fissionable plutonium, and, as a by-product, U-232 that has a daughter nuclide emitting high-energy photons.
4.3.2.5 Nuclear fusion
Energy from the fusion of heavy hydrogen fuel (deuterium, tritium) is actively being pursued as a long-term almost inexhaustible supply of energy with helium as the by-product. The scientific feasibility of fusion energy has been proven, but technical feasibility remains to be demonstrated in experimental facilities. A major international effort, the proposed international thermonuclear experimental reactor ( ITER, 2006 [NPR] ), aims to demonstrate magnetic containment of sustained, self-heated plasma under fusion temperatures. This 10 billion US$ pilot plant to be built in France is planned to operate for 20 years and will resolve many scientific and engineering challenges. Commercialization of fusion-power production is thought to become viable by about 2050, assuming initial demonstration is successful (Smith et al., 2006a [NotFound] ; Cook et al., 2005 [NPR] ).
4.3.3 Renewable energy
Renewable energy accounted for over 15% of world primary energy supply in 2004, including traditional biomass (7–8%), large hydro-electricity (5.3%, being 16% of electricity generated [1] ), and other ‘new’ renewables (2.5%) ( Table 4.2 ). Under the business-as-usual case of continued growing energy demand, renewables are not expected to greatly increase their market share over the next few decades without continued and sustained policy intervention. For example, IEA 2006b [NPR] ) projected in the Reference scenario that renewables will have dropped to a 13.7 % share of global primary energy (20.8 % of electricity) in 2030, or under the Alternative Policy scenario will have risen to 16.2 % (25.3 % of electricity).
Renewable-energy systems can contribute to the security of energy supply and protection of the environment. These and other benefits of renewable energy systems were defined in a declaration by 154 nations at the Renewables 2004 conference held in Bonn (Renewables, 2004 ). Renewable-energy technologies can be broadly classified into four categories:
1) technologically mature with established markets in at least several countries:– large and small hydro, woody biomass combustion, geothermal, landfill gas, crystalline silicon PV solar water heating, onshore wind, bioethanol from sugars and starch (mainly Brazil and US);
2) technologically mature but with relatively new and immature markets in a small number of countries:– municipal solid waste-to-energy, anaerobic digestion, biodiesel, co-firing of biomass, concentrating solar dishes and troughs, solar-assisted air conditioning, mini- and micro-hydro and offshore wind;
3) under technological development with demonstrations or small-scale commercial application, but approaching wider market introduction:– thin-film PV, concentrating PV, tidal range and currents, wave power, biomass gasification and pyrolysis, bioethanol from ligno-cellulose and solar thermal towers; and
4) still in technology research stages:– organic and inorganic nanotechnology solar cells, artificial photosynthesis, biological hydrogen production involving biomass, algae and bacteria, biorefineries, ocean thermal and saline gradients, and ocean currents.
The most mature renewable technologies (large hydro, biomass combustion, and geothermal) have, for the most part, been able to compete in today’s energy markets without policy support. Solar water heating, solar PV in remote areas, wind farms on exceptional sites, bioethanol from sugar cane, and forest residues for combined heat and power (CHP) are also competitive today in the best locations. In countries with the most mature markets, several forms of ‘new’ renewable energy can compete with conventional energy sources on an average-cost basis, especially where environmental externalities and fossil fuel price risks are taken into account. In countries where market deployment is slow due to less than optimal resources, higher costs (relative to conventional fuels) and/or a variety of market and social barriers, these technologies still require government support ( IEA, 2006e [NPR] ). Typical construction costs for new renewable energy power plants are high, between 1000 and 2500 US$/kW, but on the best sites they can generate power for around 30–40 US$/MWh thanks to low operation, maintenance and fuel costs ( Martinot, 2005 [NPR, SRC] ; NREL, 2005 [NPR] ). Costs are very variable, however, due to the diversity of resources on specific sites ( Table 4.7 ). In areas where the industry is growing, many sites with good wind, geothermal, biomass and hydro resources have already been utilized. The less mature technologies are not yet competitive but costs continue to decline due to increased learning experience as exemplified by wind, solar and bioethanol ( Figure 4.11 ).
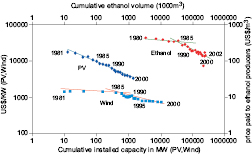
Figure 4.11: Investment costs and penetration rates for PV, wind and bioethanol systems showing cost reductions of 20% due to technological development and learning experience for every doubling of capacity once the technology has matured.
Many renewable energy sources are variable over hourly, daily and/or seasonal time frames. Energy-storage technologies may be needed, particularly for wind, wave and solar, though stored hydro reserves, geothermal and bioenergy systems can all be used as dispatchable back-up sources as can thermal power plants. Studies on intermittency and interconnection issues with the grid are ongoing (e.g., Gul and Stenzel, 2005 [NPR] ; UKERC, 2006 [NPR] ; Outhred and MacGill, 2006 [NPR] ).
A wide range of policies and measures exist to enhance the deployment of renewable energy ( IEA, 2004c [NPR] ; Martinot et al., 2005 [NPR, SRC] ; Section 4.5 ). Over 49 nations, including all EU countries along with a number of developing countries such as Brazil, China, Colombia, Egypt, India, Malaysia, Mali, Mexico, Philippines, South Africa and Thailand, and many individual states/provinces of the USA, Canada and Australia have set renewable energy targets. Some targets focus on electricity, while others include renewable heating and cooling and/or biofuels. By 2004, at least 30 states/provinces and two countries had mandates in place for blending bioethanol or biodiesel with petroleum fuels.
Since the TAR, several large international companies such as General Electric, Siemens, Shell and BP have invested further in renewable energy along with a wide range of public and private sources. Commercial banks such as Fortis, ANZ Bank and Royal Bank of Canada are financing a growing number of projects; commodity traders and financial investment firms such as Fimat, Goldman Sachs and Morgan Stanley are acquiring renewable energy companies; traditional utilities are developing their own renewable energy projects; commercial reinsurance companies such as Swiss Re and Munich Re are offering insurance products targeting renewable energy, and venture capital investors are observing market projections for wind and PV. New CDM-supported and carbon-finance projects for renewables are emerging and the OECD has improved the terms for Export Credit Arrangements for renewable energy by extending repayment terms ( Martinot et al., 2005 [NPR, SRC] ).
There has also been increasing support for renewable energy deployment in developing countries, not only from international development and aid agencies, but also from large and small local financiers with support from donor governments and market facilitators to reduce their risks. As one example, total donor funding pledges or requirements in the Bonn Renewables 2004 Action Programme amounted to around 50 billion US$ (Renewables, 2004 ). Total investment in new renewable energy capacity in 2005 was 38 billion US$, excluding large hydropower, which itself was another 15–20 billion US$ ( Martinot et al., 2006 [NPR, SRC] ).
Numerous detailed and comprehensive reports, websites, and conference proceedings on renewable energy resources, conversion technologies, industry trends and government support policies have been produced since the TAR (e.g., Renewables, 2004; BIREC, 2005 [NPR] ; Martinot et al, 2005 [NPR, SRC] ; IEA, 2004d [NPR] ; IEA, 2005d [NPR, MoS] ; IEA 2006a [NPR] ; IEA 2006c [NPR] ; WEC, 2004c [NPR] ; ISES, 2005 [NPR] ; WREC, 2006 [NPR] ; WREA, 2005 [NPR] ). The following sections address only the key points relating to progress in each major renewable energy source.
4.3.3.1 Hydroelectricity
Large (>10 MW) hydroelectricity systems accounted for over 2800 TWh of consumer energy in 2004 ( BP, 2006 [NPR] ) and provided 16% of global electricity (90% of renewable electricity). Hydro projects under construction could increase the share of electricity by about 4.5% on completion ( WEC, 2004d [NPR] ) and new projects could be deployed to provide a further 6000 TWh/yr or more of electricity economically ( BP, 2004 [NPR] ; IEA, 2006a [NPR] ), mainly in developing countries. Repowering existing plants with more powerful and efficient turbine designs can be cost effective whatever the plant scale. Where hydro expansion is occurring, particularly in China and India, major social disruptions, ecological impacts on existing river ecosystems and fisheries and related evaporative water losses are stimulating public opposition. These and environmental concerns may mean that obtaining resource permits is a constraint.
Small (<10 MW) and micro (<1 MW) hydropower systems, usually run-of-river schemes, have provided electricity to many rural communities in developing countries such as Nepal. Their present generation output is uncertain with predictions ranging from 4 TWh/yr ( WEC, 2004d [NPR] ) to 9% of total hydropower output at 250 TWh/yr ( Martinot et al., 2006 [NPR, SRC] ). The global technical potential of small and micro hydro is around 150–200 GW with many unexploited resource sites available. About 75% of water reservoirs in the world were built for irrigation, flood control and urban water-supply schemes and many could have small hydropower generation retrofits added. Generating costs range from 20 to 90 US$/MWh but with additional costs needed for power connection and distribution. These costs can be prohibitive in remote areas, even for mini-grids, and some form of financial assistance from aid programmes or governments is often necessary.
The high level of flexibility of hydro plants enables peak loads in electricity demand to be followed. Some schemes, such as the 12.6 GW Itaipu plant in Brazil/Paraguay, are run as baseload generators with an average capacity factor of >80%, whereas others (as in the 24 GW of pumped storage plant in Japan) are used mainly as fast-response peaking plants, giving a factor closer to 40% capacity. Evaluations of hybrid hydro/wind systems, hydro/hydrogen systems and low-head run-of-river systems are under review ( IEA, 2006d [NPR] ).
GHG emissions vary with reservoir location, power density (W capacity per m2 flooded), flow rate, and whether dam or run-or-river plant. Recently, the GHG footprint of hydropower reservoirs has been questioned ( Fearnside, 2004 [JoC] ; UNESCO, 2006 [NPR] ). Some reservoirs have been shown to absorb CO2 at their surface, but most emit small amounts as water conveys carbon in the natural carbon cycle ( Tremblay, 2005 [NPR] ). High emissions of CH4 have been recorded at shallow, plateau-type tropical reservoirs where the natural carbon cycle is most productive ( Delmas, 2005 [NPR] ). Deep water reservoirs at similar low latitudes tend to exhibit lower emissions. Methane from natural floodplains and wetlands may be suppressed if they are inundated by a new reservoir since the methane is oxidized as it rises through the covering water column ( Huttunen, 2005 [Ambiguous] ; dos Santos, 2005 [Ambiguous] ). Methane formation in freshwater produces by-product carbon compounds (phenolic and humic acids) that effectively sequester the carbon involved ( Sikar, 2005 [NPR] ). For shallow tropical reservoirs, further research is needed to establish the extent to which these may increase methane emissions.
Several Brazilian hydro-reservoirs were compared using life-cycle analyses with combined-cycle natural gas turbine (CCGT) plants of 50% efficiency ( dos Santos et al., 2004 [NPR] ). Emissions from flooded reservoirs tended to be less per kWh generated than those produced from the CCGT power plants. Large hydropower complexes with greater power density had the best environmental performance, whereas those with lower power density produced similar GHG emissions to the CCGT plants. For most hydro projects, life-cycle assessments have shown low overall net GHG emissions ( WEC, 2004a [NPR] ; UNESCO, 2006 [NPR] ). Since measuring the incremental anthropogenic-related emissions from freshwater reservoirs remains uncertain, the Executive Board of the UN Framework Convention on Climate Change (UNFCCC) has excluded large hydro projects with significant water storage from the CDM. The IPCC Guidelines for National GHG Inventories ( 2006 ) recommended using estimates for induced changes in the carbon stocks.
Whether or not large hydro systems bring benefits to the poorest has also been questioned ( Collier, 2006 [NPR] ; though this argument is not exclusive to hydro). The multiple benefits of hydro-electricity, including irrigation and water-supply resource creation, rapid response to grid-demand fluctuations due to peaks or intermittent renewables, recreational lakes and flood control, need to be taken into account for any given development. Several sustainability guidelines and an assessment protocol have been produced by the industry ( IHA, 2006 [NPR] ; Hydro Tasmania, 2005 [NPR] ; WCD, 2000 [NPR] ).
4.3.3.2 Wind
Wind provided around 0.5% of the total 17,408 TWh global electricity production in 2004 ( IEA, 2006b [NPR] ) but its technical potential greatly exceeds this ( WEC, 2004d [NPR] ; GWEC, 2006 [NPR] ). Installed capacity increased from 2.3 GW in 1991 to 59.3 GW at the end of 2005 when it generated 119 TWh at an average capacity factor of around 23%. New wind installation capacity has grown at an average of 28% per year since 2000, with a record 40% increase in 2005 ( BTM, 2006 [NPR, MoS] ) due to lower costs, greater government support through feed-in tariff and renewable energy certificate policies ( Section 4.5 ), and improved technology development. Total offshore wind capacity reached 679 MW at the end of 2005 ( BTM, 2006 [NPR, MoS] ), with the expectation that it will grow rapidly due to higher mean annual wind-speed conditions offsetting the higher costs and public resistance being less. Various best-practices guidelines have been produced and issues such as noise, electromagnetic (EMF) interference, airline flight paths, land-use, protection of areas with high landscape value, and bird and bat strike, are better understood but remain constraints. Most bird species exhibit an avoidance reaction to wind turbines, which reduces the probability of collision ( NERI, 2004 [NPR] ).
The average size of wind turbines has increased in the last 25 years from less than 50 kW in the early 1980 s to the largest commercially available in 2006 at around 5MW and having a rotor diameter of over 120 m. The average turbine size being sold in 2006 was around 1.6–2 MW but there is also a market for smaller turbines <100 kW. In Denmark, wind energy accounted for 18.5% of electricity generation in 2004, and 25% in West Denmark where 2.4 GW is installed, giving the highest generation per capita in the world.
Capital costs for land-based wind turbines can be below 900 US$/kW with 25% for the tower and 75% for the rotor and nacelle, although price increases have occurred due to supply shortages and increases in steel prices. Total costs of an onshore wind farm range from 1000 – 1400 US$/kW, depending on location, road access, proximity to load, etc. Operation and maintenance costs vary from 1% of investment costs in year one, rising to 4.5% after 15 years. This means that on good sites with low surface roughness and capacity factors exceeding 35%, power can be generated for around 30–50 US$/MWh ( IEA, 2006c [NPR] ; Morthorst, 2004 [NPR, MoS] ; Figure 4.12 ).
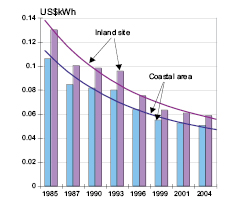
Figure 4.12: Development of wind-generation costs based on Danish experience since 1985 with variations shown due to land surface and terrain variations (as indicated by roughness indicator classes which equal 0 for open water and up to 3 for rugged terrain).
A global study of 7500 surface stations showed mean annual wind speeds at 80 m above ground exceeded 6.9 m/s with most potential found in Northern Europe along the North Sea, the southern tip of South America, Tasmania, the Great Lakes region, and the northeastern and western coasts of Canada and the US. A technical potential of 72 TW installed global capacity at 20% average capacity factor would generate 126,000 TWh/yr ( Archer and Jacobsen, 2005 [JoC] ). This is five times the assumed global production of electricity in 2030 ( IEA, 2006b [NPR] ) and double the 600 EJ potential capacity estimated by Johansson et al. 2004 [NPR] ) ( Table 4.2 ).
The main wind-energy investments have been in Europe, Japan, China, USA and India (Wind Force 12, 2005 ). The Global Wind Energy Council assumed this will change and has estimated more widespread installed capacity of 1250 GW by 2020 to supply 12% of the world’s electricity. The European Wind Energy Association set a target of 75 GW (168 TWh) for EU-15 countries in 2010 and 180 GW (425 TWh) in 2020 ( EWEA, 2004 [NPR] ). Several Australian and USA states have similar ambitious targets, mainly to meet the increasing demand for power rather than to displace nuclear or fossil-fuel plants. Rapid growth in several developing countries including China, Mexico, Brazil and India is expected since private investment interest is increasing ( Martinot et al., 2005 [NPR, SRC] ).
The fluctuating nature of the wind constrains the contribution to total electricity demand in order to maintain system reliability. To supply over 20% would require more accurate forecasting ( Giebel, 2005 [NPR, MoS] ), regulations that ensure wind has priority access to the grid, demand-side response measures, increases in the use of operational reserves in the power system ( Gul and Stenzel, 2005 [NPR] ) or development of energy storage systems ( EWEA, 2005 [NPR] ; Mazza and Hammerschlag, 2003 [NPR, MoS] ). The additional cost burden in Denmark to provide reliability was claimed to be between 1–1.5 billion € ( Bendtsen, 2003 [NPR] ) and 2–2.5 billion € per annum ( Krogsgaard, 2001 [NPR] ). However, the costs for back-up power decrease drastically with larger grid area, larger area containing distributed wind turbines and greater share of flexible hydro and natural-gas-fired power plants ( Morthorst, 2004 [NPR, MoS] ).
A trend to replace older and smaller wind turbines with larger, more efficient, quieter and more reliable designs gives higher power outputs from the same site often at a lower density of turbines per hectare. Costs vary widely with location ( Table 4.7 ). Sites with wind speeds of less than 7–8 m/s are not currently economically viable without some form of government support if conventional power-generation costs are above 50 US$/Wh (Oxera, 2005 ). A number of technologies are under development in order to maximize energy capture for lower wind-speed sites. These include: optimized turbine designs; larger turbines; taller towers; the use of carbon-fibre technology to replace glass-reinforced polymer in longer wind-turbine blades; maintenance strategies for offshore turbines to overcome difficulties with access during bad weather/rough seas; more accurate aero-elastic models and more advanced control strategies to keep the wind loads within the turbine design limits.
4.3.3.3 Biomass and bioenergy
Biomass continues to be the world’s major source of food, stock fodder and fibre as well as a renewable resource of hydrocarbons for use as a source of heat, electricity, liquid fuels and chemicals. Woody biomass and straw can be used as materials, which can be recycled for energy at the end of their life. Biomass sources include forest, agricultural and livestock residues, short-rotation forest plantations, dedicated herbaceous energy crops, the organic component of municipal solid waste (MSW), and other organic waste streams. These are used as feedstocks to produce energy carriers in the form of solid fuels (chips, pellets, briquettes, logs), liquid fuels (methanol, ethanol, butanol, biodiesel), gaseous fuels (synthesis gas, biogas, hydrogen), electricity and heat. Biomass resources and bioenergy use are discussed in several other chapters (Fig. 4.13) as outlined in Chapter 11 . This chapter 4 concentrates on the conversion technologies of biomass resources to provide bioenergy in the form of heat and electricity to the energy market.
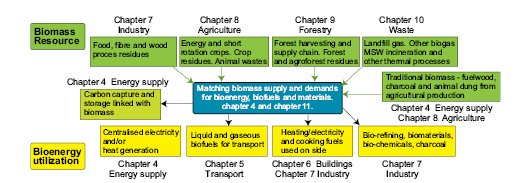
Figure 4.13: Biomass supplies originate from a wide range of sources and, after conversion in many designs of plants from domestic to industrial scales, are converted to useful forms of bioenergy.
Bioenergy carriers range from a simple firewood log to a highly refined gaseous fuel or liquid biofuel. Different biomass products suit different situations and specific objectives for using biomass are affected by the quantity, quality and cost of feedstock available, location of the consumers, type and value of energy services required, and the specific co-products or benefits IEA Bioenergy, 2005 [NPR] ). Prior to conversion, biomass feedstocks tend to have lower energy density per volume or mass compared with equivalent fossil fuels. This makes collection, transport, storage and handling more costly per unit of energy ( Sims, 2002 [NPR, SRC] ). These costs can be minimized if the biomass can be sourced from a location where it is already concentrated, such as wood-processing residues or sugar plant.
Globally, biomass currently provides around 46 EJ of bioenergy in the form of combustible biomass and wastes, liquid biofuels, renewable MSW, solid biomass/charcoal, and gaseous fuels. This share is estimated to be over 10% of global primary energy, but with over two thirds consumed in developing countries as traditional biomass for household use ( IEA, 2006b [NPR] ). Around 8.6 EJ/yr of modern biomass is used for heat and power generation ( Figure 4.14 ). Conversion is based on inefficient combustion, often combined with significant local and indoor air pollution and unsustainable use of biomass resources such as native vegetation ( Venkataraman et al., 2004 [JoC] ).
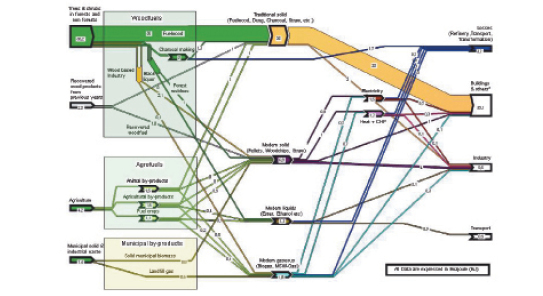
Figure 4.14: World biomass energy flows (EJ/yr) in 2004 and their thermochemical and biochemical conversion routes to produce heat, electricity and biofuels for use by the major sectors.
Residues from industrialized farming, plantation forests and food- and fibre-processing operations that are currently collected worldwide and used in modern bioenergy conversion plants are difficult to quantify but probably supply approximately 6 EJ/yr. They can be classified as primary, secondary and tertiary ( Figure 4.15 ). Current combustion of over 130 Mt of MSW provides more than 1 EJ/yr though this includes plastics, etc. ( Chapter 10 ). Landfill gas also contributes to biomass supply at over 0.2 EJ/yr ( Chapter 10 ).
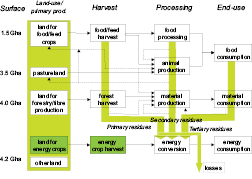
Figure 4.15: Biomass sources from land used for primary production can be processed for energy with residues available from primary, secondary and tertiary activities.
A wide range of conversion technologies is under continuous development to produce bioenergy carriers for both small- and large-scale applications. Organic residues and wastes are often cost-effective feedstocks for bioenergy conversion plants, resulting in niche markets for forest, food processing and other industries. Industrial use of biomass in OECD countries was 5.6 EJ in 2002 ( IEA, 2004a [NPR] ), mainly in the form of black liquor in pulp mills, biogas in food processing plants, and bark, sawdust, rice husks etc. in process heat boilers.
The use of biomass, particularly sugarcane bagasse, for cogeneration (CHP) and industrial, domestic and district heating continues to expand ( Martinot et al., 2005 [NPR, SRC] ). Combustion for heat and steam generation remains state of the art, but advancing technologies include second-generation biofuels ( Chapter 5 ), biomass integrated-gasification combined-cycle (BIGCC), co-firing (with coal or gas), and pyrolysis. Many are close to commercial maturity but awaiting further technical breakthroughs and demonstrations to increase efficiency and further bring down costs.
Biochemical conversion using enzymes to convert ligno-cellulose to sugars that, in turn can be converted to bioethanol, biodiesel, di-methyl ester, hydrogen and chemical intermediates in biorefineries is not yet commercial. Biochemical- and Fischer-Tropsch-based thermochemical synthesis processes can be integrated in a single biorefinery such that the biomass carbohydrate fraction is converted to ethanol and the lignin-rich residue gasified and used to produce heat for process energy, electricity and/or fuels, thus greatly increasing the overall system efficiency to 70–80% ( OECD, 2004b [NPR] ; Sims, 2004 [NPR, MoS, SRC] ).
Combustion and co-firing
Biomass can be combined with fossil-fuel technologies by co-firing solid biomass particles with coal; mixing synthesis gas, landfill gas or biogas with natural gas prior to combustion. There has been rapid progress since the TAR in the development of the co-utilisation of biomass materials in coal-fired boiler plants. Worldwide more than 150 coal-fired power plants in the 50–700 MWe range have operational experience of co-firing with woody biomass or wastes, at least on a trial basis ( IEA, 2004c [NPR] ). Commercially significant lignites, bituminous and sub-bituminous coals, anthracites and petroleum coke have all been co-fired up to 15% by energy content with a very wide range of biomass material, including herbaceous and woody materials, wet and dry agricultural residues and energy crops. This experience has shown how the technical risks associated with co-firing in different types of coal-fired power plants can be reduced to an acceptable level through proper selection of biomass type and co-firing technology. It is a relatively low-cost, low-risk method of adding biomass capacity, particularly in countries where coal-fired plants are prevalent.
Gaseous fuels
Gasification of biomass (or coal, Section 4.3.1.1 ) to synthesis (producer) gas, mainly CO and H2, has a relatively high conversion efficiency (40–45%) when used to generate electricity through a gas engine or gas turbine. The gas produced can also be used as feedstock for a range of liquid biofuels. Development of efficient BIGCC systems is nearing commercial realization, but the challenges of gas clean-up remain. Several pilot and demonstration projects have been evaluated with varying degrees of success ( IEA, 2006d [NPR] ).
Recovery of methane from anaerobic digestion plants has increased since the TAR. More than 4500 installations (including landfill-gas recovery plants) in Europe, corresponding to 3.3 Mt methane or 92 PJ/yr, were operating in 2002 with a total market potential estimated to be 770 PJ (assuming 28 Mt methane will be produced) in 2020 (Jönsson, 2004 ). Biogas can be used to produce electricity and/or heat. It can also be fed into natural gas grids or distributed to filling stations for use in dedicated or dual gas-fuelled vehicles, although this requires biogas upgrading ( Section 10.4 ).
Costs and reduction opportunities
Costs vary widely for biomass fuel sources giving electricity costs commonly between 0.05 and 0.12 US$/kWh ( Martinot et al., 2005 [NPR, SRC] ) or even lower where the disposal cost of the biomass is avoided. Cost reductions can occur due to technical learning and capital/labour substitution. For example, capital investment costs for a high-pressure, direct-gasification combined-cycle plant up to 50 MW are estimated to fall from over 2000 US$/kW to around 1100 US$/kW by 2030, with operating costs, including delivered fuel supply, also declining to give possible generation costs down to 0.03 US$/kWh ( Martinot et al., 2005 [NPR, SRC] ; Specker, 2006 [NPR] ; EIA/DOE, 2006 ). Commercial small-scale options using steam turbines, Stirling engines, organic Rankin-cycle systems etc. can generate power for up to 0.12 US$/kWh, but with the opportunity to further reduce the capital costs by mass production and experience.
4.3.3.4 Geothermal
Geothermal resources from low-enthalpy fields located in sedimentary basins of geologically stable platforms have long been used for direct heat extraction for building and district heating, industrial processing, domestic water and space heating, leisure and balneotherapy applications. High-quality high-enthalpy fields (located in geodynamically active regions with high-temperature natural steam reached by drilling at depths less than 2 km) where temperatures are above 250ºC allow for direct electricity production using binary power plants (with low boiling-point transfer fluids and heat exchangers), organic Rankin-cycle systems or steam turbines. Plant capacity factors range from 40 to 95%, with some therefore suitable for base load ( WEC, 2004b [NPR] ). Useful heat and power produced globally is around 2 EJ/yr ( Table 4.2 ).
Fields of natural steam are rare. Most are a mixture of steam and hot water requiring single- or double-flash systems to separate out the hot water, which can then be used in binary plants or for direct use of the heat ( Martinot et al., 2005 [NPR, SRC] ). Binary systems have become state-of-the-art technologies but often with additional cost. Re-injection of the fluids maintains a constant pressure in the reservoir and hence increases the life of the field, as well as overcoming any concerns at environmental impacts. Sustainability concerns relating to land subsidence, heat-extraction rates exceeding natural replenishment ( Bromley and Currie, 2003 [NPR] ), chemical pollution of waterways (e.g. with arsenic), and associated CO2 emissions have resulted in some geothermal power-plant permits being declined. This could be partly overcome by re-injection techniques. Deeper drilling up to 8 km to reach molten rock magma resources may become cost effective in future. Deeper drilling technology could also help to develop widely abundant hot dry rocks where water is injected into artificially fractured rocks and heat extracted as steam. Pilot schemes exist but tend not to be cost effective at this stage. In addition, the growth of ground-to-air heat pumps for heating buildings ( Chapter 6 ) is expected to increase.
Capital costs have declined by around 50% from the 3000–5000 US$/kW in the 1980 s for all plant types (with binary cycle plants being the more costly). Power-generation costs vary with high- and low-enthalpy fields, shallow or deep resource, size of field, resource-permit conditions, temperature of resource and the applications for any excess heat ( IEA, 2006d [NPR] ; Table 4.7 ). Operating costs increase if CO2 emissions released either entail a carbon charge or require CCS.
Several advanced energy-conversion technologies are becoming available to enhance the use of geothermal heat, including combined-cycle for steam resources, trilateral cycles for binary total-flow resources, remote detection of hot zones during exploration, absorption/regeneration cycles (e.g., heat pumps) and improved power-generation technologies ( WEC, 2004c [NPR] ). Improvements in characterizing underground reservoirs, low-cost drilling techniques, more efficient conversion systems and utilization of deeper reservoirs are expected to improve the uptake of geothermal resources as will a decline in the market value for extractable co-products such as silica, zinc, manganese and lithium ( IEA, 2006d [NPR] ).
4.3.3.5 Solar thermal electric
The proportion of solar radiation that reaches the Earth’s surface is more than 10,000 times the current annual global energy consumption. Annual surface insolation varies with latitude, ranging between averages of 1000 W/m2 in temperate regions and 1200 W/m2 in low-latitude dry desert areas.
Concentrating solar power (CSP) plants are categorized according to whether the solar flux is concentrated by parabolic trough-shaped mirror reflectors (30–100 suns concentration), central tower receivers requiring numerous heliostats (500– 1000 suns), or parabolic dish-shaped reflectors ( 1000 –10,000 suns). The receivers transfer the solar heat to a working fluid, which, in turn, transfers it to a thermal power-conversion system based on Rankine, Brayton, combined or Stirling cycles. To give a secure and reliable supply with capacity factors at around 50% rising to 70% by 2020 ( US DOE, 2005 [NPR] ), solar intermittency problems can be overcome by using supplementary energy from associated natural gas, coal or bioenergy systems ( IEA, 2006 [Ambiguous] g) as well as by storing surplus heat.
Solar thermal power-generating plants are best sited at lower latitudes in areas receiving high levels of direct insolation. In these areas, 1 km2 of land is enough to generate around 125 GWh/yr from a 50 MW plant at 10% conversion of solar energy to electricity ( Philibert, 2004 [NPR] ). Thus about 1% of the world’s desert areas (240,000 km2), if linked to demand centres by high-voltage DC cables, could, in theory, be sufficient to meet total global electricity demand as forecast out to 2030 ( Philibert, 2006 [NPR] ; IEA, 2006b [NPR] ). CSP could also be linked with desalination in these regions or used to produce hydrogen fuel or metals.
The most mature CSP technology is solar troughs with a maximum peak efficiency of 21% in terms of conversion of direct solar radiation into grid electricity. Tower technology has been successfully demonstrated by two 10 MW systems in the USA with commercial development giving long-term levelized energy costs similar to trough technology. Advanced technologies include troughs with direct steam generation, Fresnel collectors, which can reduce costs by 20%, energy storage including molten salt, integrated combined-cycle systems and advanced Stirling dishes. The latter are arousing renewed interest and could provide opportunities for further cost reductions ( WEC, 2004d [NPR] ; IEA 2004b [NPR] ).
Technical potential estimates for global CSP vary widely from 630 GWe installed by 2040 ( Aringhoff et al., 2003 [NPR] ) to 4700 GWe by 2030 ( IEA, 2003 [Ambiguous] h; Table 4.2 ). Installed capacity is 354 MWe from nine plants in California ranging from 14 to 80 MWe with over 2 million m2 of parabolic troughs. Connected to the grid during 1984 – 1991, these generate around 400 GWh/yr at 100–126 US$/MWh ( WEC, 2004d [NPR] ). New projects totalling over 1400 MW are being constructed or planned in 11 countries including Spain (500 MW supported by a new feed-in tariff) ( ESTIA, 2004 [NPR] ; Martinot et al., 2005 [NPR, SRC] ) and Israel for the first of several 100 MW plants ( Sagie, 2005 [NPR] ). The African Development Bank has financed a 50 MW combined-cycle plant in Morocco that will generate 55 GWh/yr, and two new Stirling dish projects totalling 800 MWe planned for the Mojave Desert, USA ( ISES, 2005 [NPR] ) are estimated to generate at below 90 US$/MWh Stirling,) are estimated to generate at below 90 US$/MWh Stirling,). Installed capacity of 21.5 GWe, if reached by 2020, would produce 54.6 TWh/yr with a further possible increase leading towards 5% coverage of world electricity demand by 2040 .
4.3.3.6 Solar photovoltaic (PV)
Electricity generated directly by utilizing solar photons to create free electrons in a PV cell is estimated to have a technical potential of at least 450,000 TWh/yr (Renewables, 2004; WEC, 2004d [NPR] ). However, realizing this potential will be severely limited by land, energy-storage and investment constraints. Estimates of current global installed peak capacity vary widely, including 2400 MW (Greenpeace, 2004 ); 3100 MW ( (Maycock, 2003 ) ); >4000MW generating more than 21 TWh ( Martinot et al., 2005 [NPR, SRC] ) and 5000 MW (Greenpeace, 2006 ). Half the potential may be grid-connected, primarily in Germany, Japan and California, and grow at annual rates of 50–60% in contrast to more modest rates of 15–20% for off-grid PV. Expansion is taking place at around 30% per year in developing countries where around 20% of all new global PV capacity was installed in 2004, mainly in rural areas where grid electricity is either not available or unreliable ( WEC, 2004c [NPR] ). Decentralized generation by solar PV is already economically feasible for villages with long distances to a distribution grid and where providing basic lighting and radio is socially desirable. Annual PV module production grew from 740 MW in 2003 to 1700 MW in 2005, with new manufacturing plant capacity built to meet growing demand ( Martinot et al., 2005 [NPR, SRC] ). Japan is the world market leader, producing over half the present annual production ( IEA, 2003 [Ambiguous] f). However, solar generation remains at only 0.004% of total world power.
Most commercially available solar PV modules are based on crystalline silicon cells with monocrystalline at up to 18% efficiency, having 33.2% of the market share. Polycrystalline cells at up to 15% efficiency are cheaper per Wp (peak Watt) and have 56.3% market share. Modules costing 3–4 US$/Wp can be installed for around 6–7 US$/Wp from which electricity can be generated for around 250 US$/MWh in high sunshine regions (US Climate Change Technology Program, 2005 ). Cost reductions are expected to continue ( UNDP, 2000 [NPR] ; Figure 4.11 ), partly depending on the future world price for silicon; solar-cell efficiency improvements as a result of R&D investment; mass production of solar panels and learning through project experience. Costs in new buildings can be reduced where PV systems are designed to be an integral part of the roof, walls or even windows.
Thinner cell materials have prospects for cost reduction, including thin-film silicon cells (8.8% of market share in 2003 ), thin-film copper indium diselenide cells (0.7% of market share), photochemical cells and polymer cells. Commercial thin-film cells have efficiencies up to 8%, but 10–12% should be feasible within the next few years. Experimental multilayer cells have reached higher efficiencies but their cost remains high. Work to reduce the cost of manufacturing, using low-cost polymer materials, and developing new materials such as quantum dots and nano-structures, could allow the solar resource to be more fully exploited. Combining solar thermal and PV power-generation systems into one unit has good potential as using the heat produced from cooling the PV cells would make it more efficient ( (Bakker et al., 2005 ) ).
4.3.3.7 Solar heating and cooling
Solar heating and cooling of buildings can reduce conventional fuel consumption and reduce peak electricity loads. Buildings can be designed to use efficient solar collection for passive space heating and cooling ( Chapter 6 ), active heating of water and space using glazed and circulating fluid collectors, and active cooling using absorption chillers or desiccant regeneration (US Climate Change Technology Program, 2003 ). There is a risk of lower performance due to shading of windows or solar collectors by new building construction or nearby trees. Local ‘shading’ regulations can prevent such conflicts by identifying a protected ‘solar envelope’ ( Duncan, 2005 [NPR] ). A wide range of design measures, technologies and opportunities are covered by the IEA Solar Heating and Cooling implementing agreement (www.iea-shc.org).
Active systems of capturing solar energy for direct heat are used mainly in small-scale, low-temperature, domestic hot water installations; heating of building space; swimming pools; crop drying; cook stoves; industrial processes; desalination plants and solar-assisted district heating. The estimated annual global solar thermal-collector yield of domestic hot water systems alone is around 80 TWh (0.3 EJ) with the installations growing by 20% per year. Annual solar thermal energy use depends on the area of collectors in operation, the solar radiation levels available and the technologies used including both unglazed and glazed systems. Unglazed collectors, mainly used to heat swimming pools in the USA and Europe, represented about 28 million m2 in 2003 .
More than 130 million m2 of glazed collector area was installed worldwide by the end of 2003 to provide around 0.5 EJ of heat from around 91 GWth capacity ( Weiss et al., 2005 [NPR] ). In 2005, around 125 million m2 (88 GWth) of active solar hot-water collectors existed, excluding swimming pool heating ( Martinot et al, 2005 [NPR, SRC] ). China is the world’s largest market for glazed domestic solar hot-water systems with 80% of annual global installations and existing capacity of 79 million m2 (55 GWth) at the end of 2005 . Most new installations in China are now evacuated-tube in contrast with Europe (the second-largest market), where most collectors are flat-plate ( (Zhang et al., 2005 ) ). Domestic solar hot-water systems are also expanding rapidly in other developing countries. Estimated annual energy yields for glazed flat-plate collectors range between 400 kWh/m2 in Germany and 1000 kWh/m2 in Israel ( IEA, 2004d [NPR] ). In Austria, annual solar yields were estimated to be 300 kWh/m2 for unglazed, 350 kWh/m2 for flat-plate, and 550 kWh/m2 for evacuated tube collectors ( Weiss et al., 2005 [NPR] ). The retail price for a solar water heater unit for a family home differs with location and any government support schemes. Installed costs range from around 700 US$ in Greece for a thermo-siphon system with a 2.4 m2 collector and 150 L tank, to 2300 US$ in Germany for a pumped system with antifreeze device. Systems manufactured in China are typically 200–300 US$ each.
Nearly 100 commercial solar cooling technologies exist in Europe, representing 24,000 m2 with a cooling power of 9 MWth. High potential energy savings compared with conventional electric vapour-pressure air-conditioning systems do not offset the higher costs ( Philibert and Podkanski, 2005 [NPR] ).
4.3.3.8 Ocean energy
The potential marine-energy resource of wind-driven waves, gravitational tidal ranges, thermal gradients between warm surface water and colder water at depths of > 1000 m, salinity gradients, and marine currents is huge (Renewables, 2004 ), but what is exploitable as the economic potential is low. All the related technologies (with the exception of three tidal-range barrages amounting to 260 MW, including la Rance that has generated 600 GWh/yr since 1967 ) are at an early stage of development with the only two commercial wave-power projects totalling 750 kW. To combat the harsh environment, installed costs are usually high. The marine-energy industry is now in a similar stage of development to the wind industry in the 1980 s (Carbon Trust, 2005 [NPR] ). Since oceans are used by a range of stakeholders, siting devices will involve considerable consultation.
The best wave-energy climates ( Figure 4.16 ) have deep-water power densities of 60–70 kW/m but fall to about 20 kW/m at the foreshore. Around 2% of the world’s 800,000 km of coastline exceeds 30 kW/m, giving a technical potential of around 500 GW assuming offshore wave-energy devices have 40% efficiency. The total economic potential is estimated to be well below this ( WEC, 2004d [NPR] ) with generating cost estimates around 80–110 US$/MWh highly uncertain, since no truly commercial scale plant exists ( IEA, 2006d [NPR] ).
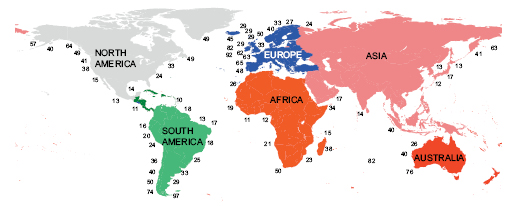
Extracting electrical energy from marine currents could yield in excess of 10 TWh/yr (0.4 EJ/yr) if major estuaries with large tidal fluctuations could be tapped, but cost estimates range from 450– 1350 US$/MWh ( IEA, 2006a [NPR] ). A 1 km-stretch of permanent turbines built in the Agulhas current off the coast of South Africa, for example, could give 100 MW of power ( Nel, 2003 [NPR] ). However, environmental effects on tidal mud flats, wading birds, invertebrates etc. would need careful analysis. In order for these new technologies to enter the market, sustained government and public support is needed.
Ocean thermal and saline gradient energy-conversion systems remain in the research stage and it is still too early to estimate their technical potential. Initial applications have been for building air conditioning (www.makai.com/p-pipelines/) for desalination in open- and hybrid-cycle plants using surface condensers and in future could benefit tropical island nations where power is presently provided by expensive diesel generators.
4.3.4 Energy carriers
Energy carriers include electricity and heat as well as solid, liquid and gaseous fuels. They occupy intermediate steps in the energy-supply chain between primary sources and end-use applications. An energy carrier is thus a transmitter of energy. For reasons of both convenience and economy, energy carriers have shown a continual shift from solids to liquids and more recently from liquids to gases ( WEC, 2004b [NPR] ), a trend that is expected to continue. At present, about one third of final energy carriers reach consumers in solid form (as coal and biomass, which are the primary cause of many local, regional and indoor air-pollution problems associated with traditional domestic uses); one third in liquid form (consisting primarily of oil products used in transportation); and one third through distribution grids in the form of electricity and gas. The share of all grid-oriented energy carriers could increase to about one half of all consumer energy by 2100 .
New energy carriers such as hydrogen ( Section 4.3.4.3 ) will only begin to make an impact around 2050, whereas the development of smaller scale decentralized energy systems and micro-grids ( Section 4.3.8 ) could occur much sooner ( Datta et al., 2002 [NPR] ; IEA, 2004d [NPR] ). Technology issues surrounding energy carriers involve the conversion of primary to secondary energy, transporting the secondary energy, in some cases storing it prior to use, and converting it to useful end-use applications ( Figure 4.17 ).
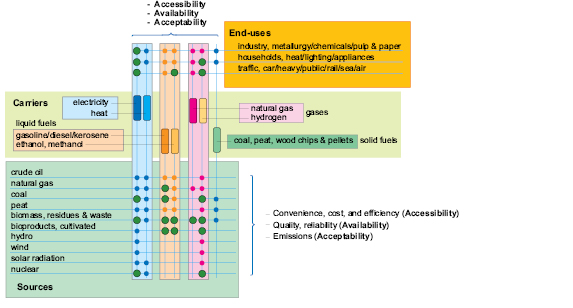
Where a conversion process transforms primary energy near the source of production (e.g. passive solar heating) a carrier is not involved. In other cases, such as natural gas or woody biomass, the primary-energy source also becomes the carrier and also stores the energy. Over long distances, the primary transportation technologies for gaseous and liquid materials are pipelines, shipping tankers and road tankers; for solids they are rail wagons, boats and trucks, and for electricity wire conductors. Heat can also be stored but is normally transmitted over only short distances of 1–2 km.
Each energy-conversion step in the supply chain invokes additional costs for capital investment in equipment, energy losses and carbon emissions. These directly affect the ability of an energy path to compete in the marketplace. The final benefit/cost calculus ultimately determines market penetration of an energy carrier and hence the associated energy source and end-use technology.
Hydrocarbon substances produced from fossil fuels and biomass are utilized widely as energy carriers in solid, slurry, liquid or gaseous forms ( Table 4.3 ). Coal, oil, natural gas and biomass can be used to produce a variety of synthetic liquids and gases for transport fuels, industrial processes and domestic heating and cooking, including petroleum products refined from crude oil. Liquid hydrocarbons have relatively high energy densities that are superior for transport and storage properties.
Table 4.3: Energy carriers of hydrocarbon substances.
| Primary energy | Energy carriers of secondary energy | |||
|---|---|---|---|---|
| Solid | Slurry | Liquid | Gas | |
| Coal | Pulverized coal Coke | Coal/water mix Coal/oil mix | Coal to liquid (CTL) Synthetic fuel | Coal gas Producer gas Blast furnace gas Water gas Gasified fuel Hydrogen |
| Oil | Oil refinery products | Oil gas Synthetic gas Hydrogen | ||
| Natural gas | LNG, LPG Gas to liquid (GTL) GTL alcoholics Di-methyl ethers | Methane Hydrogen | ||
| Biomass | Wood residues Energy crops Refuse derived fuel (RDF) | Methanol Ethanol Biodiesel esters Di-methyl ethers | Methane Producer gas Hydrogen | |
4.3.4.1 Electricity
Electricity is the highest-value energy carrier because it is clean at the point of use and has so many end-use applications to enhance personal and economic productivity. It is effective as a source of motive power (motors), lighting, heating and cooling and as the prerequisite for electronics and computer systems. Electricity is growing faster as a share of energy end-uses ( Figure 4.18 ) than other direct-combustion uses of fuels with the result that electricity intensity (Electricity/GDP) has remained relatively constant even though the overall global-energy intensity (Energy/GDP) continues to decrease. If electricity intensity continues to decrease due to efficiency increases, future electricity demand could be lower than otherwise forecast (Sections 4.4.4 and 11.3.1 ).
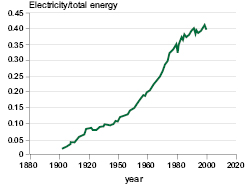
Life-cycle GHG-emission analyses of power-generation plants ( WEC 2004a [NPR] ; Vattenfall, 2005; ( Dones et al., 2005; ) van de Vate, 2002 [NotFound] ; Spadaro, 2000 [NPR] ; Uchiyama and Yamamoto, 1995 [NPR, SRC] ;( Hondo, 2005 ) ) show the relatively high CO2 emissions from fossil-fuel combustion are 10–20 times higher than the indirect emissions associated with the total energy requirements for plant construction and operation during the plant’s life ( Figure 4.19 ). Substitution by nuclear or renewable energy decreases carbon emissions per kWh by the difference between the full-energy-chain emission coefficients and allowing for varying plant-capacity factors ( WEC 2004a [NPR] ; Sims et al., 2003a [SRC] ). The average thermal efficiency for electricity-generation plants has improved from 30% in 1990 to 36% in 2002, thereby reducing GHG emissions.
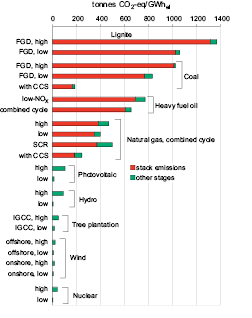
Electricity generated from traditional coal-fired, steam-power plants is expected to be displaced over time with more advanced technologies such as CCGT or advanced coal to reduce the production of GHG and increase the overall efficiency of energy use. Previous IPCC 2001 [NPR] and WEC 2001 [NPR] ) scenarios suggested that nuclear, CCGT and CCS could become dominant electricity-sector technologies early this century ( Section 4.4 ). Although CCS can play a role, its potential may be limited and hence some consider it as a transitional bridging technology.
4.3.4.2 Heat and heat pumps
Heat, whether from fossil fuels or renewable energy, is a critical energy source for all economies. Its efficient use could play an important role in the development of transition and developing economies ( UN, 2004 [NPR] ; IEA, 2004e [NPR] ). It is used in industrial processes for food processing, petroleum refining, timber drying, pulp production, etc. ( Chapter 7 ), as well as in commercial and residential buildings for space heating, hot water and cooking ( Chapter 6 ). Many industries cogenerate both heat and electricity as an integral part of their production process ( Section 4.3.5 ; Chapter 7 ), in most cases being used on-site, but at times sold for other uses off-site such as district heating schemes.
Heating and cooling using renewable energy ( Section 4.3.3.7 ) can compete with fossil fuels ( IEA, 2006 [Ambiguous] f). In some instances, the best use of modern biomass will be co-firing with coal at blends up to 5–10% biomass or with natural gas.
Heat pumps can be used for simple air-to-air space heating, air-to-water heating, and for utilizing waste heat in domestic, commercial and industrial applications ( Chapter 6 ). Thermo-dynamically reverse Carnot-cycle heat pumps are more demand-side technologies but also linked with sustainable energy supply by concentrating low-grade solar heat in air and water. Their efficiency is evaluated by the coefficient of performance (COP), with COPs of 3 to 4 available commercially and over 6 using advanced turbo-refrigeration (www.mhi.co.jp/aircon/). A combination of CCGT with advanced heat-pump technology could reduce carbon emissions from supplying heat more than using a conventional gas-fired CHP plant of similar capacity.
4.3.4.3 Liquid and gaseous fuels
Coal, natural gas, petroleum and biomass can all be used to produce a variety of liquid fuels for transport, industrial processes, power generation and, in some regions of the world, domestic heating. These include petroleum products from crude oil or coal; methanol from coal or natural gas; ethanol and fatty acid esters (biodiesel) from biomass; liquefied natural gas; and synthetic diesel fuel and di-methyl ether from coal or biomass. Of these, crude oil is the most energy-efficient fuel to transport over long distances from source to refinery and then to distribute to product demand points. After petrol, diesel oil and other light and medium distillates are extracted at the refinery, the residues are used to produce bitumen and heavy fuel oil used as an energy source for industrial processes, oil-fired power plants and shipping.
Gaseous fuels provide a great deal of the heating requirements in the developed world and increased use can lead to lower GHG and air-pollution emissions.
Hydrogen
Realizing hydrogen as an energy carrier depends on low-cost, high-efficiency methods for production, transport and storage. Most commercial hydrogen production today is based on steam reforming of methane, but electrolysis of water (especially using carbon-free electricity from renewable or nuclear energy) or splitting water thermo-chemically may be viable approaches in the future. Electrolysis may be favoured by development of fuel cells that require a low level of impurities. Current costs of electrolysers are high but declining. Producing hydrogen from fossil fuels on a large scale will need integration of CCS if GHG emissions are to be avoided. A number of routes to produce hydrogen from solar energy are also technically feasible ( Figure 4.20 ).
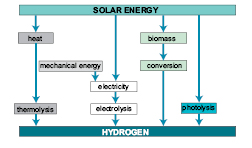
Hydrogen has potential as an energy-storage medium for electricity production or transport fuel when needed. The prospects for a future hydrogen economy will depend on developing competitively priced fuel cells for stationary applications or vehicles, but fuel cells are unlikely to become fully commercial for one or two decades. International cooperative programmes, such as the IEA Hydrogen Implementing Agreement ( IEA, 2005 [Ambiguous] f), and more recently the International Partnership for the Hydrogen Economy ( www.iphe.net ) aim to advance RD&D on hydrogen and fuel cells across the application spectrum ( IEA, 2003 [Ambiguous] g; EERE, 2005 [NPR] ).
Hydrogen fuel cells may eventually become commercially viable electricity generators, but because of current costs, complexity and state of development, they may only begin to penetrate the market later this century ( IEA, 2005 [Ambiguous] g). Ultimately, hydrogen fuel could be produced in association with CCS leading to low-emission transport fuels. Multi-fuel integrated-energy systems or ‘energyplexes’ ( Yamashita and Barreto, 2005 [Ambiguous] ) could co-produce electricity, hydrogen and liquid fuels with overall high-conversion efficiencies, low emissions and also facilitating CCS. FutureGen is a US initiative to build the world’s first integrated CCS and hydrogen-production research power plant ( US DOE, 2004 [NPR, MoS] ).
4.3.5 Combined heat and power (CHP)
Up to two thirds of the primary energy used to generate electricity in conventional thermal power plants is lost in the form of heat. Switching from condensing steam turbines to CHP (cogeneration) plants produces electricity but captures the excess heat for use by municipalities for district heating, commercial buildings ( Chapter 6 ) or industrial processes ( Chapter 7 ). CHP is usually implemented as a distributed energy resource ( Jimison, 2004 [NPR] ), the heat energy usually coming from steam turbines and internal combustion engines. Current CHP designs can boost overall conversion efficiencies to over 80%, leading to cost savings ( Table 4.4 ) and hence to significant carbon-emissions reductions per kWh generated. About 75% of district heat in Finland, for example, is provided from CHP plants with typical overall annual efficiencies of 85–90% ( Helynen, 2005 [NPR] ).
Table 4.4: Characteristics of CHP (cogeneration) plants
| Technology | Fuel | Capacity MW | Electrical efficiency (%) | Overall efficiency (%) |
|---|---|---|---|---|
| Steam turbine | Any combustible | 0.5-500 | 17-35 | 60-80 |
| Gas turbine | Gasous & liquid | 0.25-50+ | 25-42 | 65-87 |
| Combined cycle | Gasous & liquid | 3-300+ | 35-55 | 73-90 |
| Diesel and Otto engines | Gasous & liquid | 0.003-20 | 25-45 | 65-92 |
| Micro-turbines | Gasous & liquid | 0.05-0.5 | 15-30 | 60-85 |
| Fuel cells | Gasous & liquid | 0.003-3+ | 37-50 | 85-90 |
| Stirling engines | Gasous & liquid | 0.003-1.5 | 30-40 | 65-85 |
CHP plants can range from less than 5 kWe from micro-gas-turbines, fuel cells, gasifiers and Stirling engines (Whispergen, 2005 ) to 500 MWe. A wide variety of fuels is possible including biomass ( Kirjavainen et al., 2004 [NPR] ), with individual installations accepting more than one fuel. A well-designed and operated CHP scheme will provide better energy efficiency than a conventional plant, leading to both energy and cost savings ( UNEP, 2004 [NPR] ; EDUCOGEN, 2001 [NPR] ). Besides the advantage of cost reductions because of higher efficiency, CHP has the environmental benefit of reducing 160–500 gCO2/kWh, given a fossil-fuel baseline for the heat and electricity generation.
4.3.6 Carbon dioxide capture and storage (CCS)
The potential to separate CO2 from point sources, transport it and store it in isolation from the atmosphere was covered in an IPCC Special Report ( IPCC, 2005 [NPR] ). Uncertainties relate to proving the technologies, anticipating environmental impacts and how governments should incentivise uptake, possibly by regulation (OECD/IEA, 2005 ) or by carbon charges, setting a price on carbon emissions. Capture of CO2 can best be applied to large carbon point sources including coal-, gas- or biomass-fired electric power-generation or cogeneration (CHP) facilities, major energy-using industries, synthetic fuel plants, natural gas fields and chemical facilities for producing hydrogen, ammonia, cement and coke. Potential storage methods include injection into underground geological formations, in the deep ocean or industrial fixation as inorganic carbonates ( Figure 4.22 ). Application of CCS for biomass sources (such as when co-fired with coal) could result in the net removal of CO2 from the atmosphere.
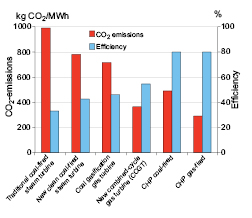
Figure 4.21: Carbon dioxide emissions and conversion efficiencies of selected coal and gas-fired power generation and CHP plants.
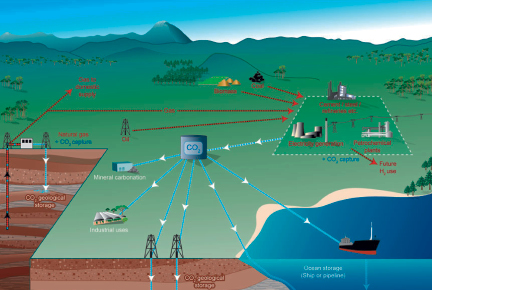
Figure 4.22: CCS systems showing the carbon sources for which CCS might be relevant, and options for the transport and storage of CO2.
Injection of CO2 in suitable geological reservoirs could lead to permanent storage of CO2. Geological storage is the most mature of the storage methods, with a number of commercial projects in operation. Ocean storage, however, is in the research phase and will not retain CO2 permanently as the CO2 will re-equilibrate with the atmosphere over the course of several centuries. Industrial fixation through the formation of mineral carbonates requires a large amount of energy and costs are high. Significant technological breakthroughs will be needed before deployment can be considered.
Estimates of the role CCS will play over the course of the century to reduce GHG emissions vary. It has been seen as a ‘transitional technology’, with deployment anticipated from 2015 onwards, peaking after 2050 as existing heat and power-plant stock is turned over, and declining thereafter as the decarbonization of energy sources progresses ( IEA, 2006a [NPR] ). Other studies show a more rapid deployment starting around the same time, but with continuous expansion even towards the end of the century ( IPCC, 2005 [NPR] ). Yet other studies show no significant use of CCS until 2050, relying more on energy efficiency and renewable energy ( IPCC, 2005 [NPR] ). Long-term analyses by use of integrated assessment models, although using a simplified carbon cycle ( Read and Lermit, 2005 [ARC] ; Smith, 2006b [NPR, ARC] ), indicated that a combination of bioenergy technologies together with CCS could decrease costs and increase attainability of low stabilization levels (below 450 ppmv).
New power plants built today could be designed and located to be CCS-ready if rapid deployment is desired ( Gibbins et al., 2006 [Ambiguous] ). All types of power plants can be made CCS-ready, although the costs and technical measures vary between different types of power plants. However, beyond space reservation for the capture, installation and siting of the plant to enable access to storage reservoirs, significant capital pre-investments at build time do not appear to be justified by the cost reductions that can be achieved ( Bohm, 2006 [NPR] ; Sekar, 2005 [NPR] ). Although generic outline engineering studies for retro-fitting capture technologies to natural-gas GTCC plants have been undertaken, detailed reports on CCS-ready plant-design studies are not yet in the public domain.
Storage of CO2 can be achieved in deep saline formations, oil and gas reservoirs and deep unminable coal seams using injection and monitoring techniques similar to those utilized by the oil and gas industry. Of the different types of potential storage formations, storage in coal formations is the least developed. If injected into suitable saline formations or into oil and gas fields at depths below 800 m, various physical and geochemical trapping mechanisms prevent the CO2 from migrating to the surface. Projects in all kinds of reservoirs are planned.
Storage capacity in oil and gas fields, saline formations and coal beds is uncertain. The IPCC ( IPCC, 2005 [NPR] ) reported 675 to 900 GtCO2 for the relatively well-characterized gas and oil fields, more than 1000 GtCO2 (possibly up to an order of magnitude higher) for saline formations, and up to 200 GtCO2 for coal beds. Bradshaw et al. 2006 [NPR, MoS] ) highlighted the incomparability of localized storage-capacity data that use different assumptions and methodologies. They also criticized any top-down estimate of storage capacity not based on a detailed site characterization and a clear methodology, and emphasized the value of conservative estimates. In the literature, however, specific estimates were based on top-down data and varied beyond the range cited in the IPCC 2005 [NPR] ). For instance, a potential of >4000 GtCO2 was reported for saline formations in North America alone ( Dooley et al., 2005 [NPR] ) and between 560 and 1170 GtCO2 for injection in oil and gas fields ( Plouchart et al., 2006 [NPR] ). Agreement on a common methodology for storage capacity estimates on the country- and region-level is needed to give a more reliable estimate of storage capacities.
Biological removal of CO2 from an exhaust stream is possible by passing the stack emissions through an algae or bacterial solution in sunlight. Removal rates of 80% for CO2 and 86% for NOX have been reported, resulting in the production of 130,000 litres/ha/yr of biodiesel (Greenfuels 2004 ) with residues utilized as animal feed. Other unconventional biological approaches to CCS or fuel production have been reported (Greenshift, 2005; Patrinos, 2006 [NPR] ). Another possibility is the capture of CO2 from air. Studies claim costs less than 75 US$/tCO2 and energy requirements of a minimum of 30% using a recovery cycle with Ca(OH)2 as a sorbent. However, no experimental data on the complete process are yet available to demonstrate the concept, its energy use and engineering costs.
Before the option of ocean injection can be deployed, significant research is needed into its potential biological impacts to clarify the nature and scope of environmental consequences, especially in the longer term ( IPCC, 2005 [NPR] ). Concerns surrounding geological storage include the risk of seismic activity causing a rapid release of CO2 and the impact of old and poorly sealed well bores on the storage integrity of depleted oil and gas fields. Risks in CO2 transportation include rupture or leaking of pipelines, possibly leading to the accumulation of a dangerous level of CO2 in the air. Dry CO2 is not corrosive to pipelines even if it contains contaminants, but it becomes corrosive when moisture is present. Any moisture therefore needs to be removed to prevent corrosion and avoid the high cost of constructing pipes made from corrosion-resistant material. Transport of CO2 by ship is feasible under specific conditions, but is currently carried out only on a small scale due to limited demand ( IPCC, 2005 [NPR] ).
Clarification of the nature and scope of long-term environmental consequences of ocean storage requires further research ( IPCC, 2005 [NPR] ). Concerns around geological storage include rapid release of CO2 as a consequence of seismic activity and the impact of old and poorly sealed well bores on the storage integrity of depleted oil and gas fields Risks are estimated to be comparable to those of similar operations ( IPCC, 2005 [NPR] ). For CO2 pipelines, accident numbers reported are very low, although there are risks of rupture or leaking leading to local accumulation of CO2 in the air to dangerous levels ( IPCC, 2005 [NPR] ).
4.3.6.1 Costs
Cost estimates of the components of a CCS system vary widely depending on the base case and the wide range of source, transport and storage options ( Table 4.5 ). In most systems, the cost of capture (including compression) is the largest component, but this could be reduced by 20–30% over the next few decades using technologies still in the research phase as well as by upscaling and learning from experience ( IPCC, 2005 [NPR] ). The extra energy required is a further cost consideration. CO2 storage is economically feasible under conditions specific to enhanced oil recovery (EOR), and in saline formations, avoiding carbon tax charges for offshore gas fields in Norway. Pipeline transport of CO2 operates as a mature market technology ( IPCC, 2005 [NPR] ), costing 1–5 US$/tCO2 per 100 km (high end for very large volumes) ( IEA, 2006a [NPR] ). Several thousand kilometres of pipelines already transport 40 Mt/yr of CO2 to EOR projects. The costs of transport and storage of CO2 could decrease slowly as technology matures further and the plant scale increases.
Table 4.5: Current cost ranges for the components of a CCS system applied to a given type of power plant or industrial source
| CCS system components | Cost range | Remarks |
|---|---|---|
| Capture from a coal- or gas-fired power plant | 15-75 US$/tCO2 net captured | Net costs of captured CO2 compared to the same plant without capture |
| Capture from hydrogen and ammonia production or gas processing | 5-55 US$/tCO2 net captured | Applies to high-purity sources requiring simple drying and compression |
| Capture from other industrial sources | 25-115 US$/tCO2 net captured | Range reflects use of a number of different technologies and fuels |
| Transport | 1-8 US$/tCO2 transported | Per 250 km pipeline or shipping for mass flow rates of 5 (high end) to 40 (low end) MtCO2/yr. |
| Geological storagea | 0.5-8 US$/tCO2 net injected | Excluding potential revenues from EOR or ECBM. |
| Geological storage: monitoring and verification | 0.1-0.3 US$/tCO2 injected | This covers pre-injection, injection, and post-injection monitoring, and depends on the regulatory requirements |
| Ocean storage | 5-30 US$/tCO2 net injected | Including offshore transportation of 100–500 km, excluding monitoring and verification |
| Mineral carbonation | 50-100 US$/tCO2 net mineralized | Range for the best case studied. Includes additional energy use for carbonation |
4.3.7 Transmission, distribution, and storage
A critical requirement for providing energy at locations where it is converted into useful services is a system to move the converted energy (e.g. refined products, electricity, heat) and store it ready for meeting a demand. Any leakage or losses ( Figure 4.23 ) result in increased GHG emissions per unit of useful consumer energy delivered as well as lost revenue.
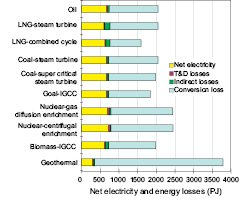
Figure 4.23: Comparison of net electricity production per 1000 MWe of installed capacity for a range of power-generation technology systems in Japan.
Electricity transmission networks cover hundreds of kilometres and have successfully provided the vital supply chain link between generators and consumers for decades. The fundamental architecture of these networks has been developed to meet the needs of large, predominantly fossil fuel-based generation technologies, often located remotely from demand centres and hence requiring transmission over long distances to provide consumers with energy services.
Transmission and distribution networks account for 54% of the global capital assets of electric power ( IEA, 2004d [NPR] ). Aging equipment, network congestion and extreme peak load demands contribute to losses and low reliability, especially in developing countries, such that substantial upgrading is often required. Existing infrastructure will need to be modernized to improve security, information and controls, and to incorporate low-emission energy systems. Future infrastructure and control systems will need to become more complex in order to handle higher, more variable loads; to recognize and dispatch small-scale generators; and to enable the integration of intermittent and decentralized sources without reduced system performance as it relates to higher load flow, frequency oscillations, and voltage quality ( IEA, 2006a [NPR] ). New networks being built should have these features incorporated, though due to private investors seeking to minimize investment costs, this is rarely the case. The demands of future systems may be significantly less than might be otherwise anticipated through increased use of distributed energy ( IEA, 2003c [NPR, MoS] ).
Superconducting cables, sensors and rapid response controls that could help to reduce electricity costs and line losses are all under development. Superconductors may incorporate hydrogen as both cryogenic coolant and energy carrier. System management will be improved by providing advanced information on grid behaviour; incorporating devices to route current flows on the grid; introduce real-time pricing and other demand-side technologies including smart meters and better system planning. The energy security challenges that many OECD countries currently face from technical failures, theft, physical threats to infrastructure and geopolitical actions are concerns that can be overcome in part by greater deployment of distributed energy systems to change the electricity-generation landscape ( IEA, 2006 [Ambiguous] g).
4.3.7.1 Energy storage
Energy storage allows the energy-supply system to operate more or less independently from the energy-demand system. It addresses four major needs: utilizing energy supplies when short-term demand does not exist; responding to short-term fluctuations in demand (stationary or mobile); recovering wasted energy (e.g. braking in mobile applications), and meeting stationary transmission expansion requirements ( Testor et al., 2005 [NPR, SRC] ). Storage is of critical importance if variable low-carbon energy options such as wind and solar are to be better utilized, and if existing thermal or nuclear systems are to be optimized for peak performance in terms of efficiencies and thus emissions. Advanced energy-storage systems include mechanical (flywheels, pneumatic), electrochemical (advanced batteries, reversible fuel cells, hydrogen), purely electric or magnetic (super- and ultra-capacitors, superconducting magnetic storage), pumped-water (hydro) storage, thermal (heat) and compressed air. Adding any of these storage systems necessarily decreases the energy efficiency of the entire system ( WEC, 2004d [NPR] ). Overall, cycle efficiencies today range from 60% for pumped hydro to over 90% for flywheels and super-capacitors ( Testor et al., 2005 [NPR, SRC] ). Electric charge carriers such as vanadium redox batteries and capacitors are under evaluation but have low energy density and high cost. Cost and durability (cycle life) of the high-technology systems remains the big challenge, possibly to be met by more advanced materials and fabrication. Energy storage has a key role for small local systems where reliability is an important feature.
4.3.8 Decentralized energy
Decentralized (or distributed) energy systems (DES) located close to customer loads often employ small- to medium-scale facilities to provide multiple-energy services referred to as ‘polygeneration’. Grid-connected DES are already commercial in both densely populated urban markets requiring supply reliability and peak shedding as well as in the form of mini-grids in rural markets with high grid connection costs and abundant renewable energy resources. Diesel-generating sets are an option, but will generally emit more CO2 per kWh than a power grid system. Renewable-energy systems connected to the grid or used instead of diesel gensets will reduce GHG emissions. The merits of DES include:
- reduced need for costly transmission systems and shorter times to bring on-stream;
- substantially reduced grid power losses over long transmission distances resulting in deferred costs for upgrading transmission and distribution infrastructure capacity to meet a growing load;
- improved reliability of industrial parks, information technology and data management systems including stock markets, banks and credit card providers where outages would prove to be very costly (IEA, 2006g);
- proximity to demand for heating and cooling systems which, for fossil fuels, can increase the total energy recovered from 40–50% up to 70–85% with corresponding reductions in CO2 emissions of 50% or more;
- zero-carbon, renewable energy sources such as solar, wind and biomass are widely distributed and useful resources for DES. However, developing decentralized mini-power grids is usual practice if these sources are to make significant local contributions to electricity supply and emission reductions.
There are added expenses, power limitations and reliability issues with DES. The World Alliance for Decentralized Energy ( WADE, 2005 [NPR] ) reported that at the end of 2004, just 7.2% of global electric power generation was supplied by decentralized systems, having a total capacity of 281.9 GWe. Capacity of DES expanded by 11.4% between 2002 and 2004, much of it as combined heat and power (CHP) using natural gas or biomass to combine electric power generation with the capture and use of waste heat for space heating, industrial and residential hot water, or for cooling. Growth in the USA, where capacity stands at 80 GWe, has been relatively slow because of regulatory barriers and the rising price of natural gas. The European market is expected to expand following the 2003 Cogeneration Directive from the European Commission, while India has added decentralized generation to enhance system reliability. Brazil, Australia and elsewhere are adding CHP facilities that use bagasse from their sugar and ethanol processing. Brazil has the potential to generate 11% of its electricity from this source. China is also adding small amounts of decentralized electric power in some of its major cities (50 GWe in 2004 ), but central power still dominates. Japan is promoting the use of natural gas-fuelled CHP with a target of almost 5000 MW by 2010 to save over 11 MtCO2 (Kantei, 2006 ). In 2005, 24% of global electricity markets from all newly installed power plants were claimed to be from DES ( WADE, 2006 [NPR] ).
The trend towards DES is growing, especially for distributed electricity generation (DG), in which local energy sources (often renewable) are utilized or energy is carried as a fuel to a point at or near the location of consumption where it is then converted to electricity and distributed locally. As well as wind, geothermal and biomass-fuelled technologies, DG systems can use a wide range of fuels to run diesel generators, gas engines, small and micro-turbines, and Stirling engines with power outputs down to <1 kWe and widely varying power-heat output ratios between 1:3 and 1:36 ( IEA, 2006a [NPR] ). The motive power of a vehicle to supply electricity could be used. Hydrogen ( Section 4.3.4.3 ), could fuel modified internal combustion engines to provide a near-term option, or fuel cells in the longer term ( Gehl, 2004 [NPR, SRC] ). A critical objective, however, will be to first increase the power density of fuel cells, reduce the installed costs and store the hydrogen safely.
Small-to-medium CHP systems at a scale of 1–40 MWe are in common use as the heat can be usefully employed on site or locally. CCS systems will probably not be economic at such a small scale. Mass production of technologies as demand increases will help reduce the current high costs of around 5000 US$/kWe for many small systems. Reciprocating engine generator sets are commercially available; micro CHP Stirling engine systems are close to market (Whispergen, 2005 ) and fuel cells with the highest power-heat ratio need significant capital cost reductions.
The recent growth in DG technologies, mainly diesel-generation based, to provide reliable back-up systems, is apparent in North America ( Figure 4.24 ). Technology advances may encourage the emergence of a new generation of higher-value energy services, including power quality and information-related services based on fuel cells with good reliability.
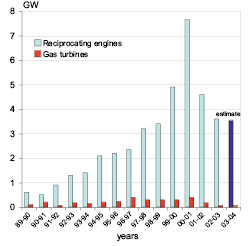
Figure 4.24: Recent growth in distributed electricity generation using fossil-fuel resources in North America.
Flexible alternating-current transmission systems (FACTS) are now being employed as components using information technology (IT) and solid-state electronics to control power flow. Numerous generators can then be controlled by the utility or line company to match the ever-changing load demand. Improved grid stability can result from appliances such as cool stores shedding load and generation plants starting up in response to system frequency variations. In addition, price sensitivities and real-time metering could be used to stimulate selected appliances to be used off-peak. IT could provide a better quality product and services for customers, but in itself may not reduce emissions if say peak load is switched to base load and the utility uses gas for peaking plants and coal for base-load plants. It could, however, enable the greater integration of more low-carbon-emitting technologies into the grid. The intermittent nature of many forms of renewable energy may require some form of energy storage or the use of a mix of energy sources and load responses to provide system reliability. To optimize the integration of intermittent renewable energy systems, IT could be used to determine generator preference and priority through a predetermined merit order based on both availability and market price.
4.3.9 Recovered energy
Surplus heat generated during the manufacturing process by some industries such as fertilizer manufacturing, can be used on site to provide process heat and power. This is covered in Chapter 7 .
4.4 Mitigation costs and potentials of energy supply
Assessing future costs and potentials across the range of energy-supply options is challenging. It is linked to the uncertainties of political support initiatives, technological development, future energy and carbon prices, the level of private and public investment, the rate of technology transfer and public acceptance, experience learning and capacity building and future levels of subsidies and support mechanisms. Just one such example of the complexity of determining the cost, potential and period before commercial delivery of a technology is the hydrogen economy. It encompasses all these uncertainties leading to considerable debate on its future technical and economic potential, and indeed whether a hydrogen economy will ever become feasible at all, and if so, when ( USCCTP, 2005 [NPR] ; IEA, 2003b [NPR] ).
Bioenergy also exemplifies the difficulties when analysing current costs and potentials for a technology as it is based on a broad range of energy sources, geographic locations, technologies, markets and biomass-production systems. In addition, future projections are largely dependent upon RD&D success and economies of plant scale. Bioethanol from ligno-cellulose, for example, has been researched for over three decades with little commercial success to date. So there can be little certainty over the timing of future successes despite the recent advances of several novel biotechnology applications. Energy technological learning is nevertheless an established fact ( WEC, 2001 [NPR] ; Johansson, 2004 [NPR] ; Section 2.7 ) and gives some confidence in projections for future market penetration.
4.4.1. Carbon dioxide emissions from energy supply by 2030
A few selected baseline ( IEA 2006b [NPR] , WEO Reference; SRES A1; SRES B2 ( Table 4.1 ); ABARE Reference) and policy mitigation scenarios ( IEA 2006b [NPR] , WEO Alternative policy; ABARE Global Technology and ABARE Global Technology +CCS) out to 2030 illustrate the wide range of possible future energy-sector mixes ( Figure 4.25 ). They give widely differing views of future energy-supply systems, the primary-energy mix and the related GHG emissions. Higher energy prices (as experienced in 2005 /06), projections that they will remain high ( Section 4.3.1 ) or current assessments of CCS deployment rates ( Section 4.3.6 ) are not always included in the scenarios. Hence, more recent studies (for example IEA 2006b [NPR] , IEA 2006d [NPR] ; Fisher, 2006 [NPR, ARC] ) are perhaps more useful for evaluating future energy supply potentials, though they still vary markedly.
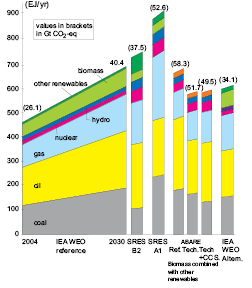
Figure 4.25: Indicative comparison of selected primary energy-supply baseline (reference) and policy scenarios from 2004 to 2030 and related total energy-related emissions in 2004 and 2030 (GtCO2-eq)
The ABARE global model, based on an original version produced for the Asia Pacific Partnership (US, Australia, Japan, China, India, Korea) ( Fisher, 2006 [NPR, ARC] ), is useful for mitigation analysis as it accounts for both higher energy prices and CCS opportunities. However, it does not separate ‘modern biomass’ from ‘other renewables’, and the modellers had also assumed that CCS would play a more significant mitigation role after 2050, rather than by the 2030 timeframe discussed here. The reference case (‘Ref’ in Figure 4.25 ) is a projection of key economic, energy and technology variables assuming the continuation of current or already announced future government policies and no significant shifts in climate policy. The Global Technology scenario (ABARE ‘Tech’) assumed that development and transfer of advanced energy-efficient technologies will occur at an accelerated rate compared with the reference case. Collaborative action from 2006 was assumed to affect technology development and transfer between several leading developed countries and hence lead to more rapid uptake of advanced technologies in electricity, transport and key industry sectors. The ‘Tech+CCS’ scenario assumed similar technology developments and transfer rates for electricity, transport and key industry sectors, but in addition CCS was utilized in all new coal- and gas-fired electricity generation plant from 2015 in US, Australia and Annex I countries and from 2020 in China, India and Korea.
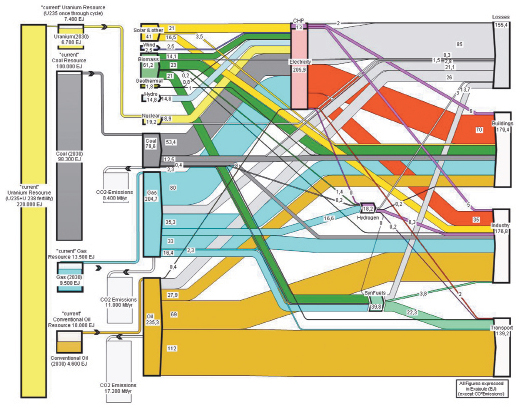
Figure 4.26: Predicted world energy sources to meet growing demand by 2030 based on updated SRES B2 scenario.
Table 4.6: Estimated carbon dioxide emissions from fossil-fuel use in the energy sector for 2002 and 2030 (MtCO2 /yr).
| 2002 | 2030 | ||
|---|---|---|---|
| Transport (includes marine bunkers) | 5999 | 10631 | |
| Industry, of which: | 9013 | 13400 | |
| Electricity | 4088 | 6667 | |
| Heat: | - coal | 2086 | 2413 |
| - oil | 1436 | 2098 | |
| - gas | 1403 | 2222 | |
| Buildings, of which: | 8967 | 14994 | |
| Electricity | 5012 | 9607 | |
| Heat: | - coal | 495 | 356 |
| - oil | 1841 | 2693 | |
| - gas | 1618 | 2338 | |
| Total | 23979a | 39025 | |
4.4.2 Cost analyses
This section places emphasis on the costs and mitigation potentials of the electricity-supply sector. Heat and CHP potentials are more difficult to determine due to lack of available data, and transport potentials are analysed in Chapter 5 .
Cost estimates are sensitive to assumptions used and inherent data inconsistencies. They vary over time and with location and chosen technology. There is a tendency for some countries, particularly where regulations are lax, to select the cheapest technology option (at times using second-hand plant) regardless of total emission or environmental impact (Royal Academy of Engineering,Cost estimates are sensitive to assumptions used and inherent data inconsistencies. They vary over time and with location and chosen technology. There is a tendency for some countries, particularly where regulations are lax, to select the cheapest technology option (at times using second-hand plant) regardless of total emission or environmental impact (Royal Academy of Engineering, Sims et al, 2003a [SRC] ). Here, based upon full life-cycle analyses in the literature, only broad cost comparisons are possible due to the wide variations in specific site costs and variations in labour charges, currency exchange rates, discount rates used, and plant capacity factors. Cost uncertainties in the electricity sector also exist due to the rate of market liberalization and the debate over the maximum level of intermittent renewable energy sources acceptable to the grid without leading to reliability issues and needing costly back-up.
One analysis compared the levelized investment, operations and maintenance (O&M), fuel and total generation costs from 27 coal-fired, 23 gas-fired, 13 nuclear, 19 wind- and 8 hydro-power plants, either operational or planned in several countries (IEA/NEA, 2005 ). The technologies and plant types included several units under construction or due to be commissioned before 2015, but for which cost estimates had been developed through paper studies or project bids ( Figure 4.27 ). The economic competitiveness of selected electricity-generation systems depends upon plant-specific features. The projected total levelized generation cost ranges tend to overlap ( Figure 4.27 ) showing that under favourable circumstances, and given possible future carbon charge additions, all technologies can be economically justified as a component in a diversified energy technology portfolio.
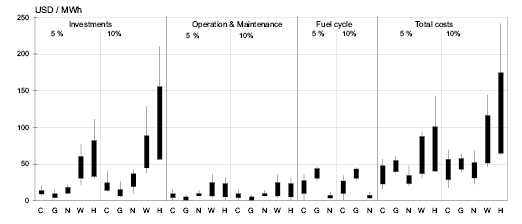
Figure 4.27: Projected power-generating levelized costs for actual and planned coal (C), gas (G) nuclear (N), wind (W) and hydro (H) power plants with assumed capital interest rates of 5 or 10%.
Construction cost assumptions ranged between 1000 and 1500 US$/kWe for coal plants; 400 and 800 US$/kW for CCGT; 1000 and 2000 US$/kW for wind; 1000 and 2000 US$/kW for nuclear and 1400 and 7000 US$/kW for hydro. Capacity factors of 85% were adopted for coal, gas and nuclear as baseload; 50% for hydro; 17 to 38% for onshore wind-power plants, and 40 to 45% for offshore wind. The costs of nuclear waste management and disposal, refurbishing and decommissioning were accounted for in all the studies reviewed, but remain uncertain. For example, decommissioning costs of a German pressurized water reactor were 155 €/kW, being 10% of the capital investment costs (IEA/NEA, 2005 ). A further study, however, calculated life-cycle costs of nuclear power to be far higher at between 47 and 70 US$/MWh by 2030 ( MIT, 2003 [NPR, MoS] ). Another cost comparison between coal, gas and nuclear options based upon five studies ( WNA, 2005b [NPR] ) showed that nuclear was up to 40% more costly than coal or gas in two studies, but cheaper in the other three. Such projected costs depend on country- and project-specific conditions and variations in assumptions made, such as the economic lifetime of the plants and capacity factors. For example, nuclear and renewable energy plants could become more competitive if gas and coal prices rise and if the externality costs associated with CO2 emissions are included.
In this regard, a European study ( EU, 2005 [NPR] ) evaluated external costs for a number of power-generation options ( Figure 4.28 ) emphasizing the zero- or low-carbon-emitting benefits of nuclear and renewables and reinforcing the benefits of CHP systems ( Section 4.3.5 ) (even though only less efficient, small-scale CHP plants were included in the analysis). This comparison highlights the value from conducting full life-cycle analyses when comparing energy-supply systems and costs ( Section 4.5.3 ).
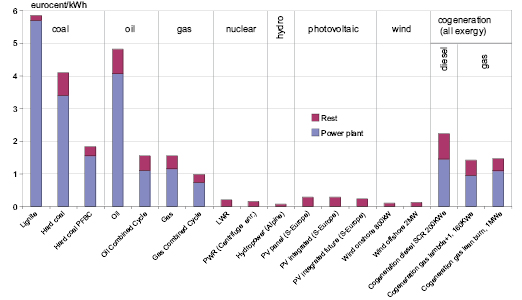
Figure 4.28: External costs (€/MWh) of current and more advanced electricity systems associated with emissions from the operation of the power plant and the rest of the fuel-supply chain ( EU, 2005 [NPR] ). ‘Rest’ is the external cost related to the fuel cycle (1 € = 1.3 US$ approximately).
A summary of cost-estimate ranges for the specific technologies as discussed in Section 4.3 is presented in Table 4.7 . Costs and technical potentials out to 2030 show that abundant supplies of primary-energy resources will remain available. Despite uncertainty due to the wide range of assumptions, renewable energy fluxes and uranium resources are in sufficient supply to meet global primary-energy demands well past 2030 ( Table 4.7 ). Proven and probable fossil-fuel reserves are also large, but concern over environmental impacts from combusting them could drive a transition to non-carbon energy sources. The speed of such a transition occurring depends, inter alia, on a number of things: how quickly investment costs can be driven down; confirmation that future life-cycle cost assessments for nuclear power, CCS and renewables are realistic; true valuation of external costs and their inclusion in energy prices; and what policies are established to improve energy security and reduce GHG emissions (University of Chicago, 2004 ).
Table 4.7: The technical potential energy resource and fluxes available, potential associated carbon and projected costs (US$ 2006 ) in 2030 for a range of energy resources and carriers.
| Energy resources and carriers | Technical potential EJa | Approximate inherent carbon (GtC) | Present energy costsc US$ (2005) | Projected costs in 2030 | Additional references | |
|---|---|---|---|---|---|---|
| Investment US$/Wed | Generation US$/MWh | |||||
| Oil | 10,000-35,000e | 200-1300 | ~9/GJ ~50/bbl ~48/MWh | n/a | 50-100 | Wall Street Journal, daily commodity prices |
| Natural gas | 18,000-60,000 | 170-860 | ~5-7/GJ ~37/MWh | 0.2-0.8 | 40-60 +CCS 60-90 | EIA/DOE, 2006 IPCC, 2005 |
| Coal | 130,000 | 3500 | ~3-4.5/GJ ~20/MWh | 0.4-1.4 | 40-55 +CCS 60-85 | EIA/DOE, 2006 IPCC, 2005 |
| Nuclear power | 7400 (220,000)f | *b | 10-120 | 1.5-3.0 | 25-75 | IAEA, 2006 Figures 4.27, 4.28 |
| Hydro > 10MW | 1250 | * | 20-100/MWh | 1.0-3.0 | 30-70 | |
| Solar PV | 40,000 | * | 250-1600/MWh | 0.6-1.2 | 60-250 | |
| Solar CSP | 50 | * | 120-450/MWh | 2.0-4.0 | 50-180 | |
| Wind | 15,000 | * | 40-90 MWh | 0.4-1.2 | 30-80 | |
| Geothermal | 50 | * | 40-100/MWh | 1.0-2.0 | 30-80 | |
| Ocean | large | * | 80-400/MWh | ? | 70-200 | |
| Biomass - | Modern 9 | 6000 | 30-120/MWh | 0.4-1.2 | 30-100 | |
| heat and power | 8-12/GJ | |||||
| Biofuels | 1.2 | * | 8-30/GJ | ? | 23-75 c/l | Chapter 5 , Figure 5.9 |
| Hydrogen carrier | 0.1 | ? | 50/GJ | ? | ? | US NAE, 2004 |
4.4.3 Evaluation of costs and potentials for low-carbon, energy-supply technologies
As there are several interactions between the mitigation options that have been described in Section 4.3 , the following sections assess the aggregated mitigation potential of the energy sector in three steps based on the literature and using the World Energy Outlook 2004 ‘Reference’ scenario as the baseline ( IEA, 2004a [NPR] ):
- The mitigation potentials in excess of the baseline are quantified for a number of technologies individually (Sections 4.4.3.1 –4.4.3.6).
- A mix of technologies to meet the projected electricity demand by 2030 is compiled for OECD, EIT and non-OECD/EIT country regions ( Section 4.4.4 ) assuming competition between technologies, improved efficiency of conversion over time and that real-world constraints exist when building new (additional and replacement) plants and infrastructure.
- The interaction of the energy supply sector with end-use power demands from the building and industry sectors is then analysed ( Section 11.3 ). Any savings of electricity and heat resulting from the uptake of energy-efficiency measures will result in some reduction in total demand for energy, and hence lower the mitigation potential of the energy supply sector.
Mitigation in the electricity supply sector can be achieved by optimization of generation plant-conversion efficiencies, fossil-fuel switching, substitution by nuclear power ( Section 4.3.2 ) and/or renewable energy (4.3.3) and by CCS (4.3.6). These low-carbon energy technologies and systems are unlikely to be widely deployed unless they become cheaper than traditional generation or if policies to support their uptake (such as carbon pricing or government subsidies and incentives) are adopted.
The costs ( Table 4.7 ) and mitigation potentials for the major energy-supply technologies are compared and quantified out to 2030 based on assumptions taken from the literature, particularly the recent IEA Energy Technology Perspectives (ETP) report ( IEA, 2006a [NPR] ). The assessment of the electricity-supply sector potentials are partly based on the TAR assessment [2] but use more recent data and revised assumptions. Heat and CHP potentials ( Section 4.3.5 ) were difficult to assess as reliable data are unavailable. For this reason the IEA aggregates commercial heat with power ( IEA, 2004a [NPR] , 2005a, 2006b ). An estimate of the potential mitigation from increased CHP uptake by industry by 2050 was 0.2–0.4 GtCO2 ( IEA, 2006a [NPR] ), but is uncertain so heat is not included here.
The 2030 electricity sector baseline ( Table 4.8 IEA, 2004a [NPR] ) was chosen because the SRES B2 scenario ( Figure 4.26 ) provided insufficient detail and the latest WEO ( IEA, 2006b [NPR] ) had not been published at the time. Estimates of the 2030 global demand for power are disaggregated for OECD, EIT, and non-OECD/EIT regions. The WEO 2004 baseline assumed that the 44% of coal in the power-generation primary fuel mix in 2002 would change to 42% by 2030; oil from 8% to 4%; gas 21% to 29%; nuclear 18% to 12%; hydro would remain the same at 6% (using the direct equivalent method); biomass 2% to 4%, and other renewables 1% to 3%.
Table 4.8: Baseline data from the World Energy Outlook 2004 Reference scenario.
| Primary-energy fuel consumed for heat and electricity production in 2030 (EJ/yr) | Primary-energy fuel consumed for electricity in 2030a (EJ /yr) | Final electricity demand in 2030 (TWh/yr) | Increase in new power demand 2002 to 2030 (TWh) | Total emissions from electricity in 2030 (GtCO2-eq/yr) | |
|---|---|---|---|---|---|
| OECD | 118.6 | 115.4 | 14,244 | 4,488 | 5.98 |
| EIT | 29.3 | 22.1 | 2,468 | 983 | 1.17 |
| Non-OECD | 128.5 | 125.3 | 14,944 | 10,111 | 8.62 |
| World | 276.4 | 262.8 | 31,656 | 15,582 | 15.77 |
This analysis quantifies the mitigation potential at the high end of the range for each technology by 2030 above the baseline. It assumes each technology will be implemented as much as economically and technically possible, but is limited by the practical constraints of stock turnover, rate of increase of manufacturing capacity, training of specialist expertise, etc. The assumptions used are compared with other analyses reported in the literature. Since, in reality, each technology will be constrained by what will be happening elsewhere in the energy-supply sector, they could never reach this total ‘maximum’ potential collectively, so these individual potentials cannot be directly added together to obtain a projected ‘real’ potential. Further analysis based on a possible future mix of generation technologies is therefore provided in Section 4.4.4 and further in Chapter 11 , accounting for energy savings reducing the total demand. Emission factors per GJ primary fuel for CO2, N2O and CH4 ( IPCC, 1997 [NPR] ) were used in the analysis but the non-CO2 gases accounted for less than 1% of emissions.
4.4.3.1 Plant efficiency and fuel switching
Reductions in CO2 emissions can be gained by improving the efficiency of existing power generation plants by employing more advanced technologies using the same amount of fuel. For example, a 27% reduction in emissions (gCO2/kWh) is possible by replacing a 35% efficient coal-fired steam turbine with a 48% efficient plant using advanced steam, pulverized-coal technology ( Table 4.9 ). Replacing a natural gas single-cycle turbine with a combined cycle (CCGT) of similar output capacity would help reduce CO2 emissions per unit of output by around 36%.
Table 4.9: Reduction in CO2 emission coefficient by fuel substitution and energy conversion efficiency in electricity generation.
| Existing generation technology | Mitigation substitution option | Emission reduction per unit of output | ||||
|---|---|---|---|---|---|---|
| Energy source | Efficiency (%) | Emission coefficient (gCO2/kWh) | Switching option | Efficiency (%) | Emission coefficient (gCO2/kWh) | (gCO2/kWh) |
| Coal, steam turbine | 35 | 973 | Pulverised coal, advanced steam | 48 | 710 | -263 |
| Coal, steam turbine | 35 | 973 | Natural gas, combined cycle | 50 | 404 | -569 |
| Fuel oil, steam turbine | 35 | 796 | Natural gas, combined cycle | 50 | 404 | -392 |
| Diesel oil, generator set | 33 | 808 | Natural gas, combined cycle | 50 | 404 | -404 |
| Natural gas, single cycle | 32 | 631 | Natural gas, combined cycle | 50 | 404 | -227 |
Switching from coal to gas increases the efficiency of the power plant because of higher operating temperatures, and when used together with the more efficient combined-cycle results in even higher efficiencies ( IEA, 2006a [NPR] ). Emission savings (gCO2-eq/kWh) were calculated before and after each substitution option (based on IPCC 1996 [Ambiguous] emission factors). The baseline scenario ( IEA, 2004a [NPR] ) assumed a 5% CO2 reduction from fossil-fuel mix changes (coal to gas, oil to gas etc.) and a further 7% reduction in the Alternative Policy scenario from fuel switching in end uses (see Chapters 6 and 7 ). By 2030, natural gas CCGT plants displacing coal, new advanced steam coal plants displacing less-efficient designs, and the introduction of new coal IGCC plants to replace traditional steam plants could provide a potential between 0.5 and 1.4 GtCO2 depending on the timing and sequence of economics and policy measures ( IEA, 2006a [NPR] ). IEA analysis also showed that up to 50 GW of stationary gas-fired fuel cells could be operating by 2030, growing to around 3% of all power generation capacity by 2050 and giving about 0.5 Gt CO2 emissions reduction ( IEA, 2006 [Ambiguous] j). This potential is uncertain, however, as it relies on appropriate fuel-cell development and is not included here.
By 2030, a proportion of old heat and power plants will have been replaced with more modern plants having higher energy efficiencies. New plants will also have been built to meet the growing world demand. It is assumed that after 2010 only the most efficient plant designs available will be built, though this is unlikely and will therefore increase future CO2 emissions above the potential reductions. The coal that could be displaced by gas and the additional gas power generation required is assessed by region ( Table 4.10 ). A plant life time of 50 years; a 2%-per-year replacement rate in all regions starting in 2010; 20% of existing coal plants replaced by 2030 and 50% of all new-build thermal plants fuelled by gas, are among the most relevant assumptions. The cost of fuel switching partly depends on the difference between coal and gas prices. For example if mitigation costs below 20 US$/tCO2-eq avoided, this would imply a relatively small price gap between coal and gas, although since fuel switching to a significant degree would affect natural gas prices, actual future costs are difficult to estimate with accuracy. Generation costs are assumed to be 40–55 US$/MWh for coal-fired and 40–60 US$/MWh for gas-fired power plants.
Table 4.10: Potential GHG emission reductions by 2030 from coal-to-gas fuel switching and improved efficiency of existing plant.
| Coal displaced by gas and improved efficiency (EJ/yr) | Additional gas power required (TWh/yr) | Emissions avoided (GtCO2-eq/yr) | Cost ranges (US$/tCO2-eq) | ||
|---|---|---|---|---|---|
| Lowest | Highest | ||||
| OECD | 7.18 | 947 | 0.39 | 0 | 12 |
| EIT | 0.73 | 79 | 0.04 | 0 | 10 |
| Non-OECD | 10.92 | 1392 | 0.64 | 0 | 11 |
| World | 18.83 | 2418 | 1.07 | ||
4.4.3.2 Nuclear
Proposed and existing fossil fuel power plants could be partly replaced by nuclear power plants to provide electricity and heat. Since the nuclear plant and fuel system consumes only small quantities of fossil fuels in the fuel cycle, net CO2 emissions could be lowered significantly. Assessments of future potential for nuclear power are uncertain and controversial. The 2006 WEO Alternative scenario ( IEA, 2006b [NPR] ) anticipated a 50% increase in nuclear energy (to 4106 TWh/yr) by 2030 . The ETP report ( IEA, 2006a [NPR] ) assumed a mitigation potential of 0.4–1.3 GtCO2 by 2030 from the construction of Generation II, III, III+ and IV nuclear plants ( Section 4.3.2 ). From a review of the literature and the various scenario projections described above (for example Figure 4.25 ), it is assumed that by 2030 18% of total global power-generation capacity could come from existing nuclear power plants as well as new plants displacing proposed new coal, gas and oil plants in proportion to their current share of the baseline ( Table 4.11 ). The rate of build required is possible (given the nuclear industry’s track record for building reactors in the 1970 s) and generating costs of 25–75 US$/MWh are assumed ( Section 4.4.2 ). However, there is still some controversy regarding the relatively low costs shown by comparative life-cycle analysis assessments reported in the literature ( Section 4.4.2 ) and used here.
Table 4.11: Potential GHG emission reduction and cost ranges in 2030 from nuclear-fission displacing fossil-fuel power plants.
| Potential contribution to electricity mix (%) | Additional generation above baseline (TWh/yr) | Emissions avoided (GtCO2-eq/yr) | Cost ranges (US$/tCO2-eq) | ||
|---|---|---|---|---|---|
| Lowest | Highest | ||||
| OECD | 25 | 1424 | 0.93 | -24 | 25 |
| EIT | 25 | 345 | 0.23 | -23 | 22 |
| Non-OECD | 10 | 974 | 0.72 | -21 | 21 |
| World | 18 | 2743 | 1.88 | ||
4.4.3.3 Renewable energy
Fossil fuels can be partly replaced by renewable energy sources to provide heat (from biomass, geothermal or solar) or electricity (from wind, solar, hydro, geothermal and bioenergy generation) or by CHP plants. Ocean energy is immature and assumed unlikely to make a significant contribution to overall power needs by 2030 . Net GHG emissions avoided are used in the analysis since most renewable energy systems emit small amounts of GHG from the fossil fuels used for manufacturing, transport, installation and from any cement or steel used in their construction. Overall, net GHG emissions are generally low for renewable energy systems ( Figure 4.19 ) with the possible exception of some biofuels for transport, where fossil fuels are used to grow the crop and process the biofuel.
Hydro
The ETP ( IEA, 2006a [NPR] ) stated the technical potential of hydropower to be 14,000 TWh/yr, of which around 6000 TWh/yr (56 EJ) could be realistic to develop ( IHA, 2006 [NPR] ). The WEO Alternative scenario ( IEA, 2006b [NPR] ) assumed an increased share for hydro generation above baseline, reaching 4903 TWh/yr by 2030 [2] IEA 2006a [NPR] ) suggested hydropower (both small and large) could offset fossil-fuel power plants to give a mitigation potential between 0.3–1.0 GtCO2/yr by 2030 . Here it is assumed that enough existing and new sites will be available to contribute around 5500 TWh/yr (17% of total electricity generation) by 2030 as a result of displacing coal, gas and oil plants based on their current share of the base load ( Table 4.12 ). Future costs range from 30–70 US$/MWh for good sites with high hydrostatic heads, close proximity to load demand, and with good all-year-round flow rates. Smaller plants and those installed in less-favourable terrain at a distance from load could cost more. GHG emissions from construction of hydro dams and possible release of methane from resulting reservoirs ( Section 4.3.3.1 ) are uncertain and not included here.
Table 4.12: Potential GHG emission reduction and cost ranges in 2030 as a result of hydro power displacing fossil-fuel thermal power plants.
| Potential contribution to electricity mix (%) | Additional generation above baseline (TWh/yr) | Net emissions avoided (GtCO2-eq/yr) | Cost ranges (US$/tCO2-eq) | ||
|---|---|---|---|---|---|
| Lowest | Highest | ||||
| OECD | 15 | 608 | 0.39 | -16 | 3 |
| EIT | 15 | 0 | 0.0 | 0 | 0 |
| Non-OECD | 20 | 643 | 0.48 | -14 | 41 |
| World | 17 | 1251 | 0.87 | ||
Wind
The 2006 WEO Reference scenario baseline ( IEA, 2006b [NPR] ) assumed 1132 TWh/yr (3.3% of total global electricity) of wind generation in 2030 rising to a 4.8% share in the Alternative Policy scenario. However, wind industry ‘advanced’ scenarios are more optimistic, forecasting up to a 29.1% share for wind by 2030 with a mitigation potential of 3.1 GtCO2/yr ( GWEC, 2006 [NPR] ). The ETP mitigation potential assessment ( IEA, 2006a [NPR] ) for on- and offshore wind power by 2030 ranged between 0.3 and 1.0 GtCO2/yr. In this analysis on- and offshore wind power is assumed to reach a 7% share by 2030, mainly in OECD countries, and to displace new and existing fossil-fuel power plants according to the relevant shares of coal, oil and gas in the baseline for each region ( Table 4.13 ). Intermittency issues on most grids would not be limiting at these low levels given suitable control and back-up systems in place. The costs are very site specific and range from 30 US$/MWh on good sites to 80 US$/MWh on poorer sites that would also need to be developed if this 7% share of the total mix is to be met.
Table 4.13: Potential GHG emission reduction and costs in 2030 from wind power displacing fossil-fuel thermal power plants.
| Potential contribution to electricity mix (%) | Additional generation above baseline (TWh/yr) | Net extra emissions reductions (GtCO2-eq/yr) | Cost ranges (US$/tCO2-eq) | ||
|---|---|---|---|---|---|
| Lowest | Highest | ||||
| OECD | 10 | 687 | 0.45 | -16 | 33 |
| EIT | 5 | 99 | 0.06 | -16 | 30 |
| Non-OECD | 5 | 572 | 0.42 | -14 | 27 |
| World | 7 | 1358 | 0.93 | ||
Bioenergy (excluding biofuels for transport)
Large global resources of biomass could exist by 2030 (Chapters 8 , 9 and 10 ), but confidence in estimating the bioenergy heat and power potential is low since there will be competition for these feedstocks for biomaterials, chemicals and biofuels. Bioenergy in its various forms (landfill gas, combined heat and power, biogas, direct combustion for heat etc.) presently contributes 2.6% to the OECD power mix, 0.4% to EIT and 1.5% to non-OECD. The WEO 2006 ( IEA, 2006b [NPR] ) assumed 805 TWh of biomass power generation in 2030 rising 22% to 983 TWh under the Alternative scenario to then give 3% of total electricity generation. The ETP gave a bioenergy potential ranging between 0.1 and 0.3 GtCO2 /yr by 2030 . The baseline ( IEA, 2004a [NPR] ) assumed biomass and waste for heat and power generation will rise from 2% of primary fuel use (3.2 EJ) in 2002 to 4% (10.8 EJ) by 2030 .
Heat and CHP estimates are wide ranging so cannot be included in this analysis, even though the bioenergy potential could be significant. However, any heat previously utilized from displaced coal and gas CHP plants could easily be supplied from biomass, with more biomass available for use in stand-alone heat plants ( Chapter 11 ). In this analysis, a 5% share in OECD regions is assumed feasible, relying on co-firing in existing and new coal plants and with 7–8% of the total replacement capacity built being bioenergy plants. In EIT regions, the available forest biomass could be utilized to gain 5% share and in non-OECD regions, where there are less stock turnover issues than in the OECD, 10% of power could come from new bioenergy plants ( Table 4.14 ). A total potential by 2030 of 5% is assumed based on costs of 30–100 US$/MWh. The biomass feedstock required to meet these potentials, assuming thermal-conversion efficiencies of 20–30%, would be around 9–13 EJ in OECD, 1–3 EJ in EIT, and 18–27 EJ in non-OECD regions. Little additional bioenergy capacity above that already assumed in the baseline is anticipated in EIT regions where only a small contribution is expected compared with developing countries. Small inputs of fossil fuels are often used to produce, transport and convert the biomass ( IEA, 2006 [Ambiguous] h), but the same is true when using the fossil fuels it replaces. Since both are of a similar order of magnitude, and these emissions are already accounted for in the overall total for fossil fuels, bioenergy is credited with zero emissions (in compliance with IPCC guidelines).
Table 4.14: Potential emissions reduction and cost ranges in 2030 from bioenergy displacing fossil-fuel thermal power plants.
| Potential contribution to electricity mix (%) | Additional generation above baseline (TWh/yr) | Net emissions reductions (GtCO2-eq/yr) | Cost ranges (US$/tCO2-eq) | ||
|---|---|---|---|---|---|
| Lowest | Highest | ||||
| OECD | 5 | 307 | 0.20 | -16 | 63 |
| EIT | 5 | 112 | 0.07 | -16 | 60 |
| Non-OECD | 10 | 1283 | 0.95 | -14 | 54 |
| World | 7 | 2415 | 1.22 | ||
Geothermal
The installed geothermal-generation capacity of over 8.9 GWe in 24 countries produced 56.8 TWh (0.3%) of global electricity in 2004 and is growing at around 20%/yr ( Bertani, 2005 [NPR] ) with the baseline giving 0.05% of total generation by 2030 . IEA WEO 2006 ( IEA, 2006b [NPR] ) assumed 174 TWh/yr by 2030 rising 6% to 185 TWh under the Alternative scenario. The ETP ( IEA, 2006a [NPR] ) gave a potential of 0.1–0.3 GtCO2-eq/yr by 2030 .
In this analysis, generation costs of 30–80 US$/MWh are assumed to provide a 2% share of the total 2030 energy mix. Direct heat applications are not included. Although CO2 emissions are assumed to be zero, as for other renewables, this may not always be the case depending on underground CO2 released during the heat extraction.
Solar
Concentrating solar power (CSP) and photovoltaics (PV) can theoretically gain a maximum 1–2% share of the global electricity mix by 2030 even at high costs. The 2006 WEO Reference scenario ( IEA, 2006b [NPR] ) estimated 142 TWh/yr of PV generation in 2030 rising to 237 TWh in the Alternative scenario but still at <1% of total generation. EPRI 2003 [NPR] ) assessed total PV capacity to be 205 GW by 2020 generating 282 TWh/yr or about 1% of global electricity demand. Other analyses range from over 20% of global electricity generation by 2040 ( Jäger-Waldau, 2003 [NPR] ) to 0.008% by 2030 with mitigation potential for both PV and CSP likely to be <0.1 GtCO2 in 2030 ( IEA, 2006a [NPR] ) The calculated minimum costs for even the best sites resulted in relatively high costs per tonne CO2 avoided ( Table 4.16 ). The baseline ( IEA, 2004a [NPR] ) gave the total solar potential as 466 TWh or 1.4% of total generation in 2030 .
In this analysis, generating costs from CSP plants could fall sufficiently to compete at around 50–180 US$/MWh by 2030 ( Trieb, 2005 [NPR] ; IEA, 2006a [NPR] ). PV installed costs could decline to around 60–250 US$/MWh, the wide range being due to the various technologies being installed on buildings at numerous sites, some with lower solar irradiation levels. Penetration into OECD and EIT markets is assumed to remain small with more support for developing country electrification.
Table 4.15: Potential emissions reduction and cost ranges in 2030 from geothermal displacing fossil-fuel thermal power plants.
| Potential contribution in electricity mix (%) | Additional geothermal (TWh/yr) | Net emissions avoided (GtCO2-eq/yr) | Cost ranges (US$/tCO2-eq) | ||
|---|---|---|---|---|---|
| Lowest | Highest | ||||
| OECD | 2 | 137 | 0.09 | -16 | 33 |
| EIT | 2 | 44 | 0.03 | -16 | 30 |
| Non-OECD | 3 | 413 | 0.31 | -14 | 27 |
| World | 2 | 594 | 0.43 | ||
Table 4.16: Potential emission reduction and cost ranges in 2030 from solar PV and CSP displacing fossil-fuel thermal power plants.
| Potential contribution to electricity mix (%) | Additional generation above baseline (TWh/yr) | Emissions reductions (GtCO2-eq/yr) | Cost ranges (US$/tCO2-eq) | ||
|---|---|---|---|---|---|
| Lowest | Highest | ||||
| OECD | 1 | 44 | 0.03 | 61 | 294 |
| EIT | 1 | 21 | 0.01 | 60 | 288 |
| Non-OECD | 2 | 275 | 0.21 | 53 | 257 |
| World | 2 | 340 | 0.25 | ||
4.4.3.4 Carbon dioxide capture and storage
In the absence of explicit policies, CCS is unlikely to be deployed on a large scale by 2030 ( IPCC, 2005 [NPR] ). The total CO2 storage potential for each region ( Hendriks et al. 2004 [NPR] ; Table 4.17 ) appears to be sufficient for storage over the next few decades, although capacity assessments are still under debate ( IPCC, 2005 [NPR] ). The proximity of a CCS plant to a storage site affects the cost, but this level of analysis was not considered here. CCS does not appear in the baseline ( IEA, 2004a [NPR] ). Penetration by 2030 is uncertain as it depends both on the carbon price and the rate of technological advances in costs and performance.
Coal CCS
ABARE ( Fisher, 2006 [NPR, ARC] ) suggested that worldwide by 2030, 1811 TWh/yr would be generated from coal with CCS (17 EJ); 7871 TWh (73 EJ) from coal without; 1492 TWh (14 EJ) from gas with; and 6315 TWh (59 EJ) from gas without. CCS would thus result in around 4.4 GtCO2 of GHG emissions avoided in 2030 giving a 17% reduction from the reference base case level ( Figure 4.25 ). In contrast, the ETP mitigation assessments for CCS with coal plants ranged between only 0.3 and 1.0 GtCO2 in 2030 ( IEA, 2006a [NPR] ), given that commercial-scale CCS demonstration will be needed before widespread deployment.
In this analysis, CCS is assumed to begin only after 2015 in OECD countries and after 2020 elsewhere, linked mainly with advanced steam coal plants installed with flue gas separation, although these IGCC plants and oxyfuel systems are only just entering the market Dow( Jones, 2006 ) ). Assuming a 50-year life of coal plants ( IEA, 2006a [NPR] ) and that 30% of new coal plants built in OECD and 20% elsewhere will be equipped with CCS, then the replacement rate of old plants by new designs with CCS incorporated is 0.6% per year in OECD and 0.4% elsewhere. Then 9% of total new and existing coal-fired plants will have CCS by 2030 in the OECD region and 4% elsewhere. Assuming 90% of the CO2 can be captured and a reduced fuel-to-electricity conversion efficiency of 30% (leading to less power available for sale – IPCC, 2005 [NPR] ), then the additional overall costs range between 20 and 30 US$/MWh depending on the ease of CO2 transport and storage specific to each plant ( Table 4.17 ).
Table 4.17: Potential emissions reduction and cost ranges in 2030 from CCS used with coal-fired power plants.
| Share of plants with CCS (%) | Coal-fired power generation with CCS (TWh/yr) | Annual emissions avoided (GtCO2-eq/yr) | Total potential storage volumea (GtCO2) | Cost ranges (US$/tCO2-eq) | ||
|---|---|---|---|---|---|---|
| v | Highest | |||||
| OECD | 9 | 388 | 0.28 | 71-1025 | 28 | 42 |
| EIT | 4 | 14 | 0.01 | 114-1250 | 22 | 33 |
| Non-OECD | 4 | 253 | 0.20 | 291-3600 | 26 | 39 |
| World | 6 | 655 | 0.49 | 476-5875 | ||
Gas CCS
The assumed life of a CCGT plant is 40 years, and with 20% of new gas-fired plants utilizing CCS starting in 2015 in OECD countries and 2020 elsewhere, then the replacement rate of old plants by new designs integrating CCS is 0.5% per year. By 2030 7% of all OECD gas plants will have CCS and 5% elsewhere. Assuming 90% of the CO2 is captured, a reduction of gas-fired power plant conversion efficiency of 15% ( IPCC, 2005 [NPR] ), and an additional overall cost ranging between 20 and 30 US$/MWh generated, then the costs and potentials by 2030 (compared with the IEA 2004a [NPR] ) baseline of no CCS) are assessed ( Table 4.18 ). The costs for both coal and gas CCS compare well with the IPCC 2005 [NPR] ) range of 15–75 US$/tCO2 ( Table 4.5 ).
Table 4.18: Potential emissions reduction and cost ranges in 2030 from CCS used with gas-fired power plants.
| Share of plants with CCS (%) | Gas-fired power generation with CCS (TWh/yr) | Annual emission avoided (GtCO2-eq/yr) | Total capture from both coal + gas, 2015-2030 (GtCO2) | Cost ranges (US$/tCO2-eq) | ||
|---|---|---|---|---|---|---|
| Lowest | Highest | |||||
| OECD | 7 | 243 | 0.12 | 8.37 | 52 | 79 |
| EIT | 5 | 78 | 0.03 | 2.03 | 43 | 64 |
| Non-OECD | 5 | 276 | 0.07 | 12.56 | 51 | 76 |
| World | 6 | 597 | 0.22 | 22.96 | ||
4.4.3.5 Summary
The cost ranges (US$/tCO2-eq avoided) for each of the technologies analysed in Section 4.4.3 are compared ( Table 4.19 ). The percentage share of the total potential is shown spread across the defined cost class ranges for each region and technology. This assumes that a linear relationship exists between the lowest and highest costs as presented in Section 4.4.3 for each technology and region.
Since each technology is assumed to be promoted individually and crowding-out by other technologies under real-world constraints is ignored, the potentials in Table 4.19 are independent and cannot be added together.
4.4.4 Electricity-supply sector mitigation potential and cost of GHG emission avoidance
To provide a more realistic indication of the total mitigation potential for the global electricity sector, further analysis is conducted based on the literature, and assuming that no additional energy-efficiency measures in the building and industry sectors will occur beyond those already in the baseline. ( Section 11.3.1 accounts for the impacts of energy efficiency on the heat and power-supply sector). The WEO 2004 baseline ( IEA, 2004a [NPR] ) is used, based on data from Price and de la Rue du Can, 2006 [NPR, ARC] ). The fuel-to-electricity conversion efficiencies were derived from the correction of the heat share in the WEO 2004 data, by assuming the share of heat in the total primary energy supply was constant from 2002 onwards.
The baseline
By 2010 total power demand is 20,185 TWh with 13,306 TWh generation coming from fossil fuels (65.9% share of the total generation mix), 3894 TWh from all renewables (19.3%), and 2985 TWh from nuclear (14.8%). Resulting emissions are 11.4 GtCO2-eq. By 2030 the increased electricity demand of 31,656 TWh is met by 22,602 TWh generated from fossil fuels, 6,126 TWh from renewables, and 2,929 TWh from nuclear power. The fossil-fuel primary energy consumed for electricity generation in 2030 produces 15.77 GtCO2-eq of emissions ( IEA, 2004a [NPR] ; Table 4.8 ).
New electricity generation plants to be built between 2010 and 2030 are to provide additional generating capacity to meet the projected increase in power demand, and to replace capacity of old, existing plants being retired during the same period. Additional capacity built after 2010, consumes an additional 82.5 EJ/yr of primary energy in order to generate 11,471 TWh/yr more electricity by 2030 . Replacement capacity built during the period consumes 72 EJ/yr in 2030 and generates 8074 TWh/yr. Therefore, the total generation from new plants in the baseline is 19,545 TWh/yr by 2030, of which 14,618 TWh/yr comes from fossil-fuel plants (75%), 3787 TWh/yr from other renewables (19%), and 1140 TWh/yr from nuclear power (6%) ( IEA, 2004a [NPR] ).
Sector analysis from 2010 to 2030
The potential for the global electricity sector to reduce baseline GHG emissions as a result of the greater uptake of low- and zero-carbon-emitting technologies is assessed. The method employed is outlined below. Fossil-fuel switching from coal to gas; substitution of coal, gas and oil plants with nuclear, hydro, bioenergy and other renewables (wind, geothermal, solar PV and solar CSP), and the uptake of CCS are all included.
- For each major world country-grouping (OECD Pacific, US and Canada, OECD Europe, EIT, East Asia, South Asia, China, Latin America, Mexico, Middle East and Africa), WEO 2004 baseline data (Price and de la Rue du Can, 2006; IEA, 2004a) are used to show the capacity of fossil-fuel thermal electricity generation per year that could be substituted after 2010, assuming a linear replacement rate and a 50-year life for existing coal, gas and oil plants. The results are then aggregated into OECD, EIT and non-OECD/EIT regional groupings.
- New generation plants built by 2030 to meet the increasing power demand are shared between fossil fuel, renewables, nuclear and, after 2015, coal and gas-fired plants with CCS. The shares of total power generation assumed for each of these technologies by 2030 are based on the literature ( Section 4.4.3 ), but also depend partly on their relative costs ( Table 4.19 ). The relatively high shares assumed for nuclear and renewable energy, particularly in OECD countries, are debatable, but supported to some extent by European Commission projections (EC, 2007).
- No early retirements of plant or stranded assets are contemplated (although in reality a faster replacement rate of existing fossil-fuel capacity could be possible given more stringent policies in future to reduce GHG emissions). The assumed replacement rates of old fossil-fuel plant capacity by nuclear, and renewable electricity, and the uptake of CCS technologies, are each based on the regional power mix shares of coal, gas and oil plants operating in the baseline.
- In reality, the future value of carbon will likely affect the actual generation shares for each technology, as will any mitigation policies in place before 2030 that encourage reductions of GHG emissions from specific components of the energy-supply sector.
- It is assumed that after 2010 only power plants with higher conversion efficiencies ( Table 4.20 ) are built.
- As fuel switching from coal to natural gas supply is assessed to be an option with relatively low costs, this is implemented first with 20% of new proposed coal-fired power plants substituted by gas-fired technologies in all regions (based on Section 4.4.3.1 ).
- It is assumed that, where cost-effective, some of the new fossil-fuel plants required according to the baseline (after adjustments for the previous step) are displaced by low- and zero-carbon-intensive technologies (wind, geothermal, hydro, bioenergy, solar, nuclear and CCS) in proportion to their relative costs and potential deployment rates. The resulting GHG emissions avoided are assessed.
- It is assumed that by 2030, wind, solar CSP and solar PV plants that displace new and replacement fossil-fuel generation are partly constrained by related environmental impact issues, the relatively high costs for some renewable plants compared to coal, gas and nuclear, and intermittency issues in power grids. However, developments in energy-storage technologies, supportive policy trends and recognition of co-benefits are assumed to partly offset these constraints. Priority grid access for renewables is also assumed. Thus, reasonably high shares in the mix become feasible ( Table 4.20 ).
- The share of electricity generation from each technology assumes that the maximum resource available is not exceeded. The available energy resources are evaluated on a regional basis to ensure all assumptions can be met in principle.
- − Any volumes of biomass needed above those available from agricultural and forest residues (Chapters 8 and 9 ) will need to be purpose-grown, so could be constrained by land and water availability. While there is some uncertainty in this respect, there should be sufficient production possible in all regions to meet the generation from bioenergy as projected in this analysis.
- − Uranium fuel supplies for nuclear plants should meet the assumed growth in demand, especially given the anticipation of ‘Gen III’ plant designs with fuel recycling coming on stream before 2030.
- − There is sufficient storage capacity for sequestering the estimated capture of CO2 volumes in all regions given the anticipated rate of growth of CCS over the next few decades (Hendricks et al., 2004).
- CCS projects for both coal- and gas-fired power plants are deployed only after 2015, assuming commercial developments are unavailable until then.
Table 4.19: Potential GHG emissions avoided by 2030 for selected, electricity generation mitigation technologies (in excess of the World Energy Outlook 2004 Reference baseline, IEA, 2004a [NPR] ) if developed in isolation and with the estimated mitigation potential shares spread across each cost range ( 2006 US$/tCO2-eq) for each region.
| Regional groupings | Mitigation potential; total emissions saved in 2030 (GtCO2-eq) | Mitigation potential (%) spread over cost ranges (US$/tCO2-eq avoided) | |||||
|---|---|---|---|---|---|---|---|
| <0 | 0-20 | 20-50 | 50-100 | >100 | |||
| Fuelswitch and plant efficiency | OECD | 0.39 | 100 | ||||
| EIT | 0.04 | 100 | |||||
| Non-OECD | 0.64 | 100 | |||||
| World | 1.07 | ||||||
| Nuclear | OECD | 0.93 | 50 | 50 | |||
| EIT | 0.23 | 50 | 50 | ||||
| Non-OECD | 0.72 | 50 | 50 | ||||
| World | 1.88 | ||||||
| Hydro | OECD | 0.39 | 85 | 15 | |||
| EIT | 0.00 | ||||||
| Non-OECD | 0.48 | 25 | 35 | 40 | |||
| World | 0.87 | ||||||
| Wind | OECD | 0.45 | 35 | 40 | 25 | ||
| EIT | 0.06 | 35 | 45 | 20 | |||
| Non-OECD | 0.42 | 35 | 50 | 15 | |||
| World | 0.93 | ||||||
| Bioenergy | OECD | 0.20 | 20 | 25 | 40 | 15 | |
| EIT | 0.07 | 20 | 25 | 40 | 15 | ||
| Non-OECD | 0.95 | 20 | 30 | 45 | 5 | ||
| World | 1.22 | ||||||
| Geothermal | OECD | 0.09 | 35 | 40 | 25 | ||
| EIT | 0.03 | 35 | 45 | 20 | |||
| Non-OECD | 0.31 | 35 | 50 | 15 | |||
| World | 0.43 | ||||||
| Solar PV and CSP | OECD | 0.03 | 20 | 80 | |||
| EIT | 0.01 | 20 | 80 | ||||
| Non-OECD | 0.21 | 25 | 75 | ||||
| World | 0.25 | ||||||
| CCS + coal | OECD | 0.28 | 100 | ||||
| EIT | 0.01 | 100 | |||||
| Non-OECD | 0.20 | 100 | |||||
| World | 0.49 | ||||||
| CCS + gas | OECD | 0.09 | 100 | ||||
| EIT | 0.04 | 30 | 70 | ||||
| Non-OECD | 0.19 | 100 | |||||
| World | 0.32 | ||||||
4.4.4.1 Mitigation potentials of the electricity supply sector
Based on the method described above and the results from the analysis ( Table 4.20 ), the following conclusions can be drawn.
With reference to the baseline:
a) power plants existing in 2010 that remain in operation by 2030 ( Table 4.20 ), including coal, oil and gas-fired, continue to generate 12,111 TWh/yr in 2030 (38% of the total power demand) and produce 5.77 GtCO2-eq/yr of emissions;
b) new additional plants to be built over the 20-year period from 2010 generate 11,471 TWh/yr by 2030 and new plants built to replace old plants generate 8074 TWh/yr;
c) the share of all new build plants burning coal, oil and gas produce around 10 GtCO2-eq/yr by 2030, thereby giving total baseline emissions of 15.77 GtCO2-eq/yr ( Table 4.8 ).
For costs < 20 US$/tCO2-eq avoided:
a) The baseline generation from fossil fuel-fired plants in 2030 of 22,602 TWh (including 14,618 TWh from new generation) reduces by 22.5% to 17,525 TWh (including 9541 TWh of new build generation) due to the increased uptake of low- and zero-carbon technologies. This is a reduction from the 71% of total generation in the baseline to 55%.
b) Of this total, fuel switching from coal to gas results in additional gas-fired plants generating 1,495 TWh/yr by 2030, mainly in non-OECD/EIT countries, and thereby avoiding 0.67 GtCO2-eq/yr of emissions.
c) Renewable energy generation increases from the 2030 baseline of 6126 TWh/yr to 7904 TWh/yr (6122 TWh/yr from new generation plus 2336 TWh/yr remaining in operation from 2010 ). The share of generation increases from 19.4% in 2010 to 26.7% by 2030 .
d) The nuclear power baseline of 2929 TWh/yr by 2030 (9.3% of total generation) increases to 5673 TWh/yr (17.9% of generation), of which 3882 TWh/yr is from newly built plants.
e) Overall, GHG emissions are reduced by 3.95 GtCO2-eq giving 25.0% lower emissions than in the baseline. Around half of this potential occurs in non-OECD/EIT countries with OECD countries providing most of the remainder.
f) Should just 70% of the individual power-generation shares assumed above for all the mitigation technologies be achieved by 2030, the mitigation potential would reduce to 1.69 GtCO2-eq.
g) This range is in reasonable agreement with the TAR analysis potential of 1.3 to 2.5 GtCO2-eq/yr for less than 27 US$/tCO2-eq avoided ( IPCC, 2001 [NPR] ), because this potential was only out to 2020, the baseline has since been adjusted, and since the TAR was published there has been increased acceptance for improved designs of nuclear power plants, an increase in development and deployment of renewable energy technologies and a better understanding of CCS technologies.
For costs <50 US$/tCO2-eq avoided:
a) Fossil-fuel generation reduces further to 13,308 TWh/yr (of which 5324 TWh/yr is from new build plants) and accounts for 42% of total generation.
b) Renewable-energy generation increases to 10,673 TWh/yr by 2030 giving a 33.7% share of total generation. Solar PV and CSP are more costly ( Table 4.19 ) so they can only offer substitution for fossil fuels above 50 US$/tCO2-eq avoided.
c) Nuclear power share of total generation remains similar since other technologies now compete.
d) CCS now becomes competitive and 2003 TWh/yr is generated by coal and gas-fired plants with CCS systems installed.
e) Overall GHG emissions in 2030 are now reduced by 6.44 GtCO2-eq/yr below the baseline, although if only 70% of the assumed shares of total power generation for all the mitigation technologies are reached by 2030, the potential declines to 3.05 GtCO2-eq. Non-OECD/EIT countries continue to provide half of the mitigation potential.
For costs <100 US$/tCO2-eq avoided:
a) As more low- and zero-carbon technologies become competitive, fossil-fuel generation without CCS further reduces to 11,824 TWh in 2030 and is now only 37% of total generation.
b) New renewable energy generation increases to 8481 TWh/yr by 2030, which together with the plants remaining in operation from 2010, gives a 34% share of total generation.
c) Nuclear power provides 3574 TWh or 17% of total generation.
d) Coal- and gas-fired plants with CCS account for 3650 TWh/yr by 2030 or 12% of total generation.
e) The overall mitigation potential of the electricity sector is 7.22 GtCO2-eq/yr which is a reduction of around 45% of GHGs below the baseline. If only 70% of the assumed shares of power generation by all low- and zero-emission technologies are achieved, then the potential would be around 45% lower at 3.97 GtCO2-eq. Non-OECD/EIT countries contribute over half the total potential.
No single technological option has sufficient mitigation potential to meet the economic potential of the electricity-generation sector. To achieve these potentials by 2030, the relatively high investment costs, the difficulties in rapidly building sufficient capacity and expertise, and the threats resulting from introducing new low-carbon technologies as perceived by the incumbents in the existing markets, will all need to be addressed.
This analysis concentrates on the individual mitigation potentials for each technology at the high end of the wide range found in the literature ( Figure 4.29 b; IEA, 2006a [NPR] ; IEA, 2006b [NPR] ). This serves to illustrate that significant reductions in emissions from the energy-supply sector are technically and economically feasible using both the range of technology solutions currently available and those close to market. Reducing the individual assumed shares of the technologies in the 2030 power generation mix by 30% gives less ambitious potentials that are closer to the lower end of the ranges found in the literature ( Figure 4.29 a). Energy-efficiency savings of electricity use in the buildings ( Chapter 6 ) and industry ( Chapter 7 ) sectors will reduce these total emissions potentials ( Section 11.3.1 ).
Table 4.20: Projected power demand increase from 2010 to 2030 as met by new, more efficient additional and replacement plants that will displace 60% of existing plants at the end of their life. The potential mitigation above the baseline of GHG avoided for <20 US$/t, <50 US$/t and <100 US$/tCO2-eq results from fuel switching from coal to gas, a portion of fossil-fuel generation being displaced by nuclear, renewable energy and bioenergy in each region and CCS.
| Power plant efficiencies by 2030 (based on IEA 2004a)a (%) | Existing mix of power generation in 2010 (TWh) | Generation from additional new plant by 2030 (TWh) | Generation from new plant replacing old, existing 2010 plant by 2030 (TWh) | Share of mix of generation of total new and replacement plant built by 2030 including CCS at various costs of US$/tCO2-eq avoidedb | Total GtCO2-eq avoided by fuel switching, CCS and displacing some fossil fuel generation with low carbon option of wind, solar, geothermal, hydro, nuclear and biomass | |||||
|---|---|---|---|---|---|---|---|---|---|---|
| <20 US$/t TWh | <50 US$/t TWh | <100 US$/t TWh | <20 US$/t | <50 US$/t | <100 US$/t | |||||
| OECD | 11302 | 2942 | 4521 | 7463 | 1.58 | 2.58 | 2.66 | |||
| Coal | 41 | 4079 | 657 | 1632 | 899 | 121 | 0 | |||
| Oil | 40 | 472 | -163c | 189 | 13 | 2 | 0 | |||
| Gas | 48 | 2374 | 1771 | 950 | 1793 | 637 | 458 | |||
| Nuclear | 33 | 2462 | -325 | 985 | 2084 | 2084 | 1777 | |||
| Hydro | 100 | 1402 | 127 | 561 | 1295 | 1295 | 1111 | |||
| Biomass | 28 | 237 | 168 | 95 | 263 | 499 | 509 | |||
| Other renewables | 63 | 276 | 707 | 110 | 1116 | 1544 | 1526 | |||
| CCS | 0 | 1282 | 2082 | |||||||
| EIT | 1746 | 722 | 698 | 1420 | 0.32 | 0.42 | 0.49 | |||
| Coal | 32 | 381 | 13 | 152 | 72 | 46 | 29 | |||
| Oil | 29 | 69 | -8 | 28 | 11 | 7 | 4 | |||
| Gas | 39 | 652 | 672 | 261 | 537 | 357 | 240 | |||
| Nuclear | 33 | 292 | -20 | 117 | 442 | 442 | 442 | |||
| Hydro | 100 | 338 | 35 | 135 | 170 | 170 | 170 | |||
| Biomass | 48 | 4 | 7 | 2 | 47 | 109 | 121 | |||
| Other renewables | 36 | 10 | 23 | 4 | 142 | 167 | 191 | |||
| CCS | 0 | 123 | 222 | |||||||
| Non-OECD/EIT | 7137 | 7807 | 2855 | 10662 | 2.06 | 3.44 | 4.08 | |||
| Coal | 38 | 3232 | 3729 | 1293 | 2807 | 1697 | 1133 | |||
| Oil | 38 | 646 | 166 | 258 | 297 | 179 | 120 | |||
| Gas | 46 | 1401 | 2459 | 560 | 3114 | 2279 | 1856 | |||
| Nuclear | 33 | 231 | 289 | 92 | 1356 | 1356 | 1356 | |||
| Hydro | 100 | 1472 | 874 | 589 | 1463 | 2106 | 2106 | |||
| Biomass | 19 | 85 | 126 | 34 | 621 | 1294 | 1443 | |||
| Other renewables | 28 | 70 | 164 | 28 | 1004 | 1154 | 1303 | |||
| CCS | 0 | 598 | 1345 | |||||||
| TOTAL | 20185 | 11471 | 8074 | 19545 | 3.95 | 6.44 | 7.22 | |||
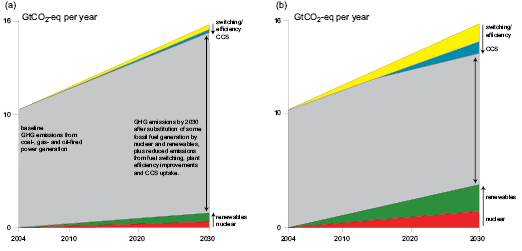
Figure 4.29: Indicative low(a) and high(b) range estimates of the mitigation potential in the electricity sector based on substitution of existing fossil-fuel thermal power stations with nuclear and renewable energy power generation, coupled with energy-efficiency improvements in power-generation plants and transmission, including switching from coal to gas and the uptake of CCS. CHP and heat are not included, nor electricity savings from energy-efficiency measures in the building and industry sectors.
4.4.4.2 Uncertainties
The wide range of energy supply-related potentials in the literature is due to the many uncertainties and assumptions involved. This analysis of the costs and mitigation potential for energy-supply technologies through to 2030 involved the following degrees of confidence.
- There is high agreement on the energy types and amounts of current global and regional energy sources used in the baseline (with the exception of traditional biomass, for which data are uncertain) because the several sources of those estimates are in close agreement.
- There is high agreement that energy supply will grow between now and 2030 with medium confidence in projections of the total energy demand by 2030. Most assumptions about population and energy use in various scenarios do not diverge greatly until after 2030, although past experience suggests that projections, even over a 25-year period, can be erroneous.
- Estimates of specific potentials out to 2030 for electricity-supply technologies based on specific studies have only low agreement that a single value can be estimated accurately. However, there is medium confidence that the true potential of a mixture of supply technologies lies somewhere within the range estimated.
- The actual distribution of new technologies in 2030 can be estimated with medium confidence by using trend analyses, technology assessments, economic models and other techniques, but cannot take into account changing national policies and preferences, future carbon-price factors, and the unanticipated evolution of technologies or their cost. Current rates of adoption for particular technologies have been identified but there is low to medium agreement that these rates may continue until 2030.
- Despite the methodological limitations, the future costs and technical potentials identified provide a medium confidence for considering strategies and decisions over the next several decades. The analysis falls within the range of other projections for specific technologies.
4.4.4.3 Transport biofuels
Assessments for the uptake of biofuels range between 20 and 25% of global transport road fuels by 2050 and beyond ( Chapter 5 ). The 2006 WEO ( IEA, 2006b [NPR] ) Reference scenario predicted biofuels will supply 4% of road fuels by 2030 with greater potential up to 7% under the Alternative Policy scenario. To achieve double this penetration, as envisaged under the Beyond Alternative Policy scenario, would avoid around 0.5GtCO2/ yr, but is likely to require large-scale introduction of second-generation biofuels from ligno-cellulosic conversions. Based on ETP assumptions ( IEA, 2006a [NPR] ), the mitigation potential of biofuels by 2030 is likely to be less than from vehicle efficiency improvements ( Chapter 5 ; Figure 4.30 ).
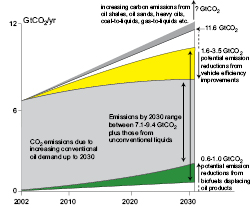
Figure 4.30: Potential increased emissions from the greater uptake of unconventional oils by 2030 could offset potential reductions from both biofuels and vehicle-efficiency improvements, but will be subject to the future availability and price of conventional oil.
Transport emissions of 6.7 GtCO2 in 2002 will increase under business as usual to 11.6 GtCO2 by 2030, but could be reduced by efficiency improvements together with the increased uptake of biofuels to emit between 7.1 and 9.4 GtCO2 ( IEA, 2006a [NPR] ). This mitigation potential of between 2.2 and 4.5 GtCO2, however, could be partially offset by the increased uptake of unconventional liquid fuels ( Section 4.3.1.4 ). Their potential is uncertain as, being more costly per litre to produce, they will be dependent partly on the future oil price and level of reserves. Overall then, the emissions from transport fuels up to 2030 will probably continue to rise ( Chapter 5 ).
4.4.4.4 Heating and cooling
The wide range of fuels and applications used for temperature modifications and the poor data base of existing heat and refrigeration plants makes the mitigation potential for heating and cooling difficult to assess. IEA 2006a [NPR] ) calculated the mitigation potential by 2030 for buildings ( Chapter 6 ) of up to 2.6 GtCO2/yr, including 0.1-0.3 GtCO2/yr for solar systems, and up to 0.6 GtCO2/yr for industry ( Chapter 7 ). The mitigation potentials of CHP and trigeneration (heating, cooling and power generation) have not been assessed here.
4.5 Policies and instruments
4.5.1 Emission reduction policies
The reduction of GHG emissions from energy-supply systems is being actively pursued through a variety of government policies and private sector research. There are many technologies, behavioural changes and infrastructural developments that could be adopted to reduce the environmental impacts of current energy-supply systems (see Chapter 13 ). Whereas planning policies provide background for climate-change mitigation programmes, most climate policies relating to energy supply tend to come from three policy ‘families’ ( OECD, 2002a [NPR] ):
- economic instruments (e.g. subsidies, taxes, tax exemption and tax credit);
- regulatory instruments (e.g. mandated targets, minimum performance standards, vehicle-exhaust emission controls); and
- policy processes (e.g. voluntary agreements and consultation, dissemination of information, strategic planning).
In addition, governments support RD&D programmes with financial incentives or direct investment to stimulate the development and deployment of new innovative energy-conversion technologies and create markets for them ( Section 4.5.6 ).
Many GHG emission-reduction policies undertaken to date aim to achieve multiple objectives. These include market and subsidy reform, particularly in the energy sector ( Table 4.21 ). In addition, governments are using a variety of approaches to overcome market barriers to energy-efficiency improvements and other ‘win-win’ actions.
Selecting policies and measures is not an easy task. It depends on many factors, including costs, potential capacity, the extent to which emissions must be reduced, environmental and economic impacts, rates at which the technology can be introduced, government resources available and social factors such as public acceptance. When implementing policies and measures, governments could consider the impacts of measures on other economies such as the specific needs and concerns of least developed countries arising from the adverse effects of climate change, on those nations that rely heavily on income generated from fossil-fuel exports, and on oil-importing developing countries.
Table 4.21: Examples of policy measures given general policy objectives and options to reduce GHG emissions from the energy-supply sector.
| Policy objectives | Policy options | Economic instruments | Regulatory instruments | Policy processes | ||
|---|---|---|---|---|---|---|
| Voluntary agreements | Dissemination of information and strategic planning | Technological RD&D and deployment | ||||
| Energy efficiency | Higher energy taxes Lower energy subsidies Power plant GHG taxes Fiscal incentives Tradable emissions permits | Power plant minimum efficient standards Best available technologies prescriptions | Voluntary commitments to improve power plant efficiency | Information and education campaigns. | Cleaner power generation from fossil fuels | |
| Energy source switching | GHG taxes Tradable emissions permits Fiscal incentives | Power plant fuel portfolio standards | Voluntary commitments to fuel portfolio changes | Information and education campaigns. | Increased power generation from renewable, nuclear, and hydrogen as an energy carrier | |
| Renewable energy | Capital grants Feed-in tariffs Quota obligation and permit trading GHG taxes radable emissions permits | Targets Supportive transmission tariffs and transmission access | Voluntary agreements to install renewable energy capacity | Information and education campaigns Green electricity validation | Increased power generation from renewable energy sources | |
| Carbon capture and storage | GHG taxes Tradable emissions permits | Emissions restrictions for major point source emitters | Voluntary agreements to develop and deploy CCS | Information campaigns | Chemical and biological sequestration Sequestration in underground geological formations | |
4.5.1.1 Emission-reduction policies for energy supply
Subsidies, incentives and market mechanisms presently used to promote fossil fuels, nuclear power and renewables may need some redirection to achieve more rapid decarbonization of the energy supply.
Subsidies and other incentives
The effects of various policies and subsidies that support fossil-fuel use have been reviewed ( IEA, 2001 [NPR] ; OECD, 2002b [NPR] ; Saunders and Schneider, 2000 [NPR] ). Government subsidies in the global energy sector are in the order of 250–300 billion US$/yr, of which around 2–3% supports renewable energy ( (de Moor, 2001; ) UNDP 2004a [NPR] ). An OECD study showed that global CO2 emissions could be reduced by more than 6% and real income increased by 0.1% by 2010 if support mechanisms on fossil fuels used by industry and the power-generation sector were removed ( OECD, 2002b [NPR] ). However, subsidies are difficult to remove and reforms would need to be conducted in a gradual and programmed fashion to soften any financial hardship.
For both environmental and energy-security reasons, many industrialized countries have introduced, and later increased, grant support schemes for producing electricity, heat and transport fuels based on nuclear or renewable energy resources and on installing more energy-efficient power-generation plant. For example, the US has recently introduced federal loan guarantees that could cover up to 80% of the project costs, production tax credits worth 6 billion US$, and 2 billion US$ of risk coverage for investments in new nuclear plants (Energy Policy Act, 2005 ). To comply with the 2003 renewable energy directive, all European countries have installed feed-in tariffs or tradable permit schemes for renewable electricity ( EEA, 2004 [NPR] ; EU, 2003 [NPR] ). Several developing countries including China, Brazil, India and a number of others have adopted similar policies.
Quantitative targets
Setting goals and quantitative targets for low-carbon energy at both national and regional levels increases the size of the markets and provides greater policy stability for project developers. For example, EU-15 members agreed on targets to increase their share of renewable primary energy to 12% of total energy by 2010 including electricity to 22% and biofuels to 5.75% ( (EU, 2001; ) EU 2003 [NPR] ). The Latin American and Caribbean Initiative, signed in May 2002 included a target of 10% renewable energy by 2010 ( Goldemberg, 2004 [NPR] ). The South African Government mandated an additional 10 TWh renewable energy contribution by 2013 (being 4% of final energy consumption) to the existing contribution of 115 TWh/yr mainly from fuel wood and waste ( DME, 2003 [NPR] ). Many other countries outlined similar targets at the major renewable energy conference in Bonn (Renewables, 2004 ) attended by 154 governments, but not to the extent that emissions will be reduced below business as usual.
Feed-in tariffs/Quota obligations
Quota obligations with tradable permits for renewable energy and feed-in tariffs have been used in many countries to accelerate the transition to renewable energy systems ( Martinot, 2005 [NPR, SRC] ). Both policies essentially serve different purposes, but they both help promote renewable energy ( (Lauber, 2004 ) ). Price-based, feed-in tariffs (providing long price certainty for renewable energy producers) have been compared with quantity-based instruments, including quotas, green certificates and competitive bidding ( Sawin, 2003a [NPR] ;( Menanteau et al., 2003; ) ( Lauber, 2004 ) ). The total level of support provided for preferential power tariffs in EU-15, in particular Germany, Italy and Spain, exceeded 1 billion € in 2001 ( EEA, 2004 [NPR] ).
Experience confirms that incentives to support ‘green power’ by rewarding performance are preferable to a capital investment grant, because they encourage market deployment while also promoting increases in production efficiency ( Neuhoff, 2004 [NPR] ). In terms of installed renewable energy capacity, better results have been obtained with price-based than with quantity-based approaches ( EC, 2005 [NPR] ; Ragwitz et al., 2005 [NPR] ; Fouquet et al., 2005 [NPR] ). In theory, this difference should not exist as bidding prices that are set at the same level as feed-in tariffs should logically give rise to comparable capacities being installed. The discrepancy can be explained by the higher certainty of current feed-in tariff schemes and the stronger incentive effect of guaranteed prices.
The potential advantages offered by green certificate trading systems based on fixed quotas are encouraging a number of countries and states to introduce such schemes to meet renewable energy goals in an economically efficient way. Such systems can encourage more precise control over quotas, create competition among producers and provide incentives to lower costs ( (Menanteau et al., 2003 ) ). Quota-obligation systems are only beginning to have an effect on capacity additions, in part because they are still new. However, about 75% of the wind capacity installed in the US between 1998 and 2004 occurred in states with renewable energy standards. Experience shows that if certificates are delivered under long-term agreements, effectiveness and compliance can be high ( Linden et al., 2005 [NPR] ; UCS, 2005 [NPR] ).
Tradable permit systems and CDM
In recent years, domestic and international tradable emission permit systems have received recognition as a means of lowering the costs of meeting climate-change targets. Creating carbon markets can help economies identify and realize economic ways to reduce GHG emissions and other energy-related pollutants, or to improve efficiency of energy use. The cost of achieving the Kyoto Protocol targets in OECD regions could fall from 0.2% of GDP without trading to 0.1% ( Newman et al., 2002 [NPR] ) as a result of introducing emission trading in an international regime. Emission trading, such as the European and CDM schemes, is designed to result in immediate GHG reductions, but CDM also has long-term aspects, since the projects must assist developing countries in achieving sustainable development (see Chapter 13 ). The CDM successfully registered 450 projects by the end of 2006 under the UNFCCC by the Executive Board with many more in the pipeline. Since the first project entered the pipeline in December 2003, 76% of projects belong to the energy sector. If all the 1300 projects in the pipeline at the end of 2006 are successfully registered with the UNFCCC and perform as expected, an accumulated emission reduction of more than 1400 MtCO2-eq by end of 2012 can be expected ( UNEP, 2006 [NPR] ).
Information instruments
Education, technical training and public awareness are essential complements to GHG mitigation policies. They provide direct and continuous incentives to think, act and buy ‘green’ energy and to use energy wisely. Green power schemes, where consumers may choose to pay more for electricity generated primarily from renewable energy sources, are an example of combining information with real choice for the consumer ( Newman et al., 2002 [NPR] ). Voluntary energy and emissions savings programmes, such as Energy Star ( EPA, 2005a [NPR] ), Gas Star ( EPA, 2005b [NPR] ) and Coalbed Methane Outreach ( EPA, 2005c [NPR] ) serve to effectively disseminate relevant information and reduce knowledge barriers to the efficient and clean use of energy. These programmes include public education aspects, but are also built on industry/government partnerships. However, uncertainties on the effectiveness of information instruments for climate-change mitigation remain. More sociological research would improve the knowledge on adequacy of information instruments ( Chapter 13 ).
Technology development and deployment
The need for further investments in R&D of all low-carbon-emission technologies, tied with the efficient marketing of these products, is vital to climate policy. Programmes supporting ‘clean technology’ development and diffusion are a traditional focus of energy and environmental policies because energy innovations face barriers all along the energy-supply chain (from R&D, to demonstration projects, to widespread deployment). Direct government support is often necessary to hasten deployment of radically new technologies due to a lack of industry investment. This suggests that there is a role for the public sector in increasing investment directly and in correcting market and regulatory obstacles that inhibit investment in new technology through a variety of fiscal instruments such as tax deduction incentives (Energy Policy Act, 2005; ( Jaffe et al, 2005 ) ).
Following the two oil crises in the 1970 s, public expenditure for energy RD&D rose steeply, but then fell steadily in industrial countries from 15 billion US$ in 1980 to about 7 billion US$ in 2000 ( 2002 prices and exchange rates). Shares of IEA member-country support for energy R&D over the period 1974 – 2002 were about 8% for renewable energy, 6% for fossil fuel, 18% for energy efficiency, 47% for nuclear energy and 20% on other items ( IEA, 2004b [NPR] ). During this period, a number of national governments (e.g. US, Germany, United Kingdom, France, Spain and Italy) made major cuts in their support for energy R&D. Public spending on energy RD&D increased in Japan, Switzerland, Denmark and Finland and remained stable in other OECD countries (Goldemberg and Johannson, 2004 ).
Technology deployment is a critical activity and learning from market experience is fundamental to the complicated process of advancing a technology toward economic efficiency while encouraging the development of large-scale, private-sector infrastructure ( IEA, 2003 [Ambiguous] h). This justifies new technology deployment support by governments ( Section 4.5.6 ).
4.5.1.2 Policy implementation experiences—successes and failures
Experiences of early policy implementation in the 1990 s to reduce GHG emissions exist all over the world. This section lists and evaluates some examples. The fast penetration of wind power in Denmark was due to a regulated, favourable feed-in tariff. However, a new energy act in 1999 changed the policy to one based on the trading of green certificates. This created considerable uncertainty for investors and led to a significant reduction in annual investments in wind power plants during recent years ( (Johansson and Turkenburg, 2004 ) ).
In Germany, a comprehensive renewable energy promotion approach launched at the beginning of the 1990 s led to it becoming the world leader in terms of installed wind capacity, and second in terms of installed PV capacity. The basic elements of the German approach are a combination of policy instruments, favourable feed-in tariffs and security of support to reduce investment risks ( (Johansson and Turkenburg, 2004 ) ).
When Spain passed a feed-in law in 1994, relatively few wind turbines were in operation. By the end of 2002, the country ranked second in the world, but had less success with solar PV in spite of having high solar radiation levels and setting PV tariffs similar to those in Germany. Little PV capacity was installed initially because regulations to enable legal grid connection were not established until 2001 when national technical standards for safe grid connection were implemented. PV producers who sold electricity into the grid, including individual households, had to register as businesses in order not to pay income tax on their sales ( Sawin, 2003a [NPR] ). Significant growth in Spanish PV manufacturing in recent years is more attributable to the neighbouring German market ( (Ristau, 2003 ) ).
In 1990, the UK government launched the first of several rounds of competitive bidding for renewable energy contracts, known as the Non-Fossil Fuel Obligation (NFFO). The successive tendering procedures resulted in regular decreases in the prices for awarded contract value for wind and other renewable electricity projects. The average price for project proposals, irrespective of the technology involved, decreased from 0.067 €/kWh in 1994 to 0.042 €/kWh by 1998, being only 0.015 €/kWh above the wholesale electricity pool reference purchase price for the corresponding period ( Menanteau et al., 2001 [NPR] ). Due to only relatively small volumes of renewable electricity being realized through the tender process, the government changed to a support mechanism by placing an obligation on electricity suppliers to sell a minimum percentage of power from new renewable energy sources. The annual growth rate of electricity generation by eligible renewable energy plants has significantly increased since the introduction of the obligation in April 2002 ( OFGEM, 2005 [NPR] ).
Swedish renewable energy policy during the 1970 s and 1980 s focused on strong efforts in technology research and demonstration. Subsequently market development took off during the 1990 s when taxes and subsidies created favourable economic conditions for new investments and fuel switching. The use of biomass increased substantially during the 1990 s (for example forest residues for district heating increased from 13 PJ in 1990 to 65 PJ in 2001 ). Increased carbon taxes created strong incentives for fuel switching from cheaper electric and oil-fired boiler for district heating to biomass cogeneration. The increase of biomass utilization led to development of the technology for biomass extraction from forests, production of short-rotation coppice Salix and implementation of more efficient district heating conversion technologies ( Johansson, 2004 [NPR] ).
Japan launched a ‘Solar Roofs’ programme in 1994 to promote PV through low-interest loans, a comprehensive education and awareness programme and rebates for grid-connected residential systems. In 1997, the rebates were opened to owners and developers of housing complexes and Japan become the world’s largest installer of PV modules ( (Haas, 2002 ) ). Government promotion included publicity on television and in newspapers ( IEA, 2003 [Ambiguous] f). Total capacity increased at an average of more than 42% annually between 1994 and 2002 with more than 420 MW installed leading to a 75% cost reduction per Watt( (Maycock, 2003; ) IEA, 2003 [Ambiguous] f). The rebates declined gradually from 50% of installed cost in 1994 to 12% in 2002 when the programme ended. Japan is now the world’s leading manufacturer, having surpassed the US in the late 1990 s.
China’s State Development and Planning Commission launched a renewable energy Township Electrification Program in 2001 to provide electricity to remote rural areas by means of stand-alone renewable energy power systems. During 2002 – 2004, almost 700 townships received village-scale solar PV stations of approximately 30–150 kW (about 20 MW total), of which few were hybrid systems with wind power (about 800 kW total of wind). Overall, the government provided 240 million US$ to subsidize the capital costs of equipment and around one million rural dwellers were provided with electricity from PV, wind-PV hybrid, and small hydropower systems ( Martinot, 2005 [NPR, SRC] ). Given the difficulties of other rural electrification projects using PV ( ERC, 2004 [NPR] ), it is too early to assess the effectiveness of this programme.
The California expansion plan to aid the installation of a million roofs of solar power in the residential sector in the next ten years was signed into law in August 2006 (Environment California, 2006 ). The law increased the cap on net metering from 0.5% of a utility’s load to 2.5%. A solar rebate programme will be created and it will be mandatory that solar panels become a standard option for new homebuyers.
4.5.2 Air quality and pollution
The Johannesburg Plan of Implementation ( UNDESA, 2002 [NPR] ) called on all countries to develop more sustainable consumption and production patterns. Policies and measures to promote such pathways will automatically result in a reduction of GHG emissions and be useful to control air pollution ( Section 11.8 ). Non-toxic CO2 emissions from combustion processes have no detrimental effects on a local or regional scale, whereas toxic emissions such as SO2 and particulates can have local health impacts as well as potentially wider detrimental environmental impacts.
The need for uncontaminated food and clean water to maintain general health have been recognized and addressed for a long time. However, only in recent decades has the importance of clean air to health been seriously noted ( WHO, 2003 [NPR] ). Major health problems suffered by women and children in the developing world (acute respiratory infection, chronic obstructive lung disease, cancer and pulmonary diseases) have been attributed to a lack of access to high-quality modern energy for cooking ( (Smith, 2002; ) ( Smith et al., 2000a; ) ( Lang et al., 2002; ) ( Bruce et al., 2000 ) ). The World Health Organisation ( WHO, 2002 [NPR] ) ranked indoor air pollution from burning solid fuels as the fourth most important health-risk factor in least developed countries where 40% of the world’s population live, and is estimated to be responsible for 2.7% of the global burden of disease ( Figure 4.31 ). It has been estimated that half a million children and women die each year in India alone from indoor air pollution ( (Smith et al., 2000a ) ). A study of indoor smoke levels conducted in Kenya revealed 24-hour average respirable particulate concentrations as high as 5526 µg/m3 compared with the EPA standards for acceptable annual levels of 50 µg/m3 ( ITDG, 2003 [NPR] ) and the EU standard for PM10 of 40 µg/m3 (European Council Directive 99/30/EC). Another comprehensive study in Zimbabwe showed that those who came from households using wood, dung or straw for cooking were more than twice as likely to have suffered from acute respiratory disease than those coming from households using LPG, natural gas or electricity ( (Mishra, 2003 ) ).
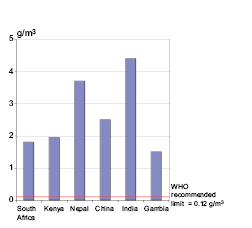
Figure 4.31: Indoor levels of particulate concentrations emitted from wood fuel combustion in selected developing countries
Feasible and cost-effective solutions to poor air quality in both urban and rural areas need to be urgently identified and implemented (World Bank, 1998 [NPR] ). Increasing access to modern energy services can help alleviate air-quality problems as well as realize a decrease in GHG emissions as greater overall efficiency is often achieved over the entire domestic energy cycle, starting from the provision of primary energy up to the eventual end-use. For instance, a shift from burning crop residues to LPG, kerosene, ethanol gel or biogas could decrease indoor air pollution by approximately 95% ( (Smith et al., 2000b; ) Sims et al, 2003b [NPR, SRC] ; Goldemberg et al., 2004 [NPR] ; Larson and Yang, 2004 [ARC] ).
Policies and measures aimed at increasing sustainability through reduction of energy use, energy-efficiency improvements, switching from the use of fossil fuels, and reducing the production of process wastes, will result in a simultaneous lowering of GHG emissions and reduced air pollution. Conversely, there are cases where measures taken to improve air quality can result in a simultaneous increase in the quantity of GHGs emitted. This is most likely to occur in those developing countries experiencing a phase of strong economic growth, but where it may not be economically feasible or desirable to move rapidly away from the use of an indigenous primary energy source such as oil or coal ( Brendow, 2004 [NPR] ).
Most regulations for air quality rely on limiting emissions of pollutants, often incorporating ambient air-quality guidelines or standards ( Sloss et al., 2003 [NPR] ). Although regulations to limit CO2 emissions could be incorporated as command and control clauses in most of the existing legislative schemes, no country has so far attempted to do so. Rather, emissions trading has emerged as the preferred method of effecting global GHG mitigation, both within and outside the auspices of the Kyoto Protocol ( Sloss et al., 2003 [NPR] ).
Ambient air-quality standards or guidelines are usually set in terms of protecting health or ecosystems. They are thus applicable only at or near ground level where acceptable concentrations of gaseous emissions such as SO2 can often be achieved through atmospheric dispersion using a tall stack as opposed to physical removal by scrubbers. Tall stacks avoid excessive ground-level concentrations of gaseous pollutants and are still in use at the majority of existing industrial installations and power plants around the world. If the use of tall stacks is precluded due to stringent limits being set for ambient SO2 concentrations mandate, then the alternative of SO2 scrubbers or other end-of-pipe removal equipment will require energy for its operation and thus divert it away from the production process. This leads to an overall decrease in cycle efficiency with a concomitant increase in CO2 emissions. Sorbent extraction or other processes necessary to support scrubber operations also have GHG emissions associated with them. This effectively amounts to trading off a potential local or regional acid rain problem against a larger global climate problem. The overall costs of damage due to unmitigated CO2 emissions have been estimated to greatly exceed those from regional acidification impacts arising from insufficient control of SO2 emissions ( Chae and Hope, 2003 [JoC] ).
Air-quality legislation needs to be approached using the principles of integrated pollution prevention and control if unexpected and unwanted climate impacts on a global scale are to be avoided ( Nalbandian, 2002 [NPR] ). Adopting a multi-parameter approach could be useful. A US proposal calls for a cap and trade scheme for the power sector, simultaneously covering SO2, NOx, mercury and CO2, which would specifically avoid conflicts with conventional regulations. Facilities would be required to optimize control strategies across all four pollutants ( Burtraw and Toman, 2000 [NPR, MoS] ). An approach developed for Mexico City showed that linear programming, applied to a database comprising emission-reduction information derived separately for air pollutants and GHGs, could provide a useful decision support tool to analyse least-cost strategies for meeting co-control targets for multiple pollutants ( (West et al., 2004 ) ).
4.5.3 Co-benefits of mitigation policies
Mitigation policies relating to energy efficiency of plants, fuel switching, renewable energy uptake and nuclear power, may have several objectives that imply a diverse range of co-benefits. These include the mitigation of air-pollution impacts, energy-supply security (by increased energy diversity), technological innovation, reduced fuel cost, employment and reducing urban migration. Reducing GHG emissions in the energy sector yields a global impact, but the co-benefits are typically experienced on a local or regional level. The variety of co-benefits stemming from GHG mitigation policies and the utilization of new energy technologies can be an integral part of economic policies that strive to facilitate sustainable development. These include improved health, employment and industrial development, and are explored in Chapter 11 . This section therefore only covers aspects specifically related to energy supply. Quantitative information remains primarily limited to health effects with many co-effects not quantified due to a lack of information.
Fuel switching and the growth of energy-efficiency programmes ( Swart et al., 2003 [JoC, ARC] ) can lead to air-quality improvements and economic benefits as well as reduced GHG emissions ( Beg, 2002 [NPR] ). The relatively high capital costs for many renewable energy technologies are offset by the fuel input having minimal or zero cost and not prone to price fluctuations, as is the case with fossil fuels ( Janssen, 2002 [NPR] ). Nuclear energy shares many of the same market co-benefits as renewables ( Hagen et al., 2005 [NPR] ). Benefits of GHG mitigation may only be expected by future generations, but co-benefits are often detectable to the current generation.
Co-benefits of mitigation can be important decision criteria in analyses by policymakers, but often neglected ( Jochem and Madlener, 2002 [NPR, ARC] ). There are many cases where the net co-benefits are not monetised, quantified or even identified by decision-makers and businesses. Due consideration of co-benefits can significantly influence policy decisions concerning the level and timing of GHG mitigation action. There may be significant economic advantages to the national stimulation of technical innovation and possible spillover effects, with developing countries benefiting from innovation stimulated by GHG mitigation in industrialized countries. Most aspects of co-benefits have short-term effects, but they support long-term mitigation policies by creating a central link to sustainable development objectives ( Kessels and Bakker, 2005 [NPR] ). To date, most analyses have calculated GHG mitigation costs by dividing the incremental costs of ‘mitigation technologies’ by the amount of GHG avoided. This implicitly attributes all the costs to GHG-emission reduction and the co-benefits are seen as ancillary. Ideally, one would attribute the incremental costs to the various co-benefits by attempting to weight them. This could lead to significantly lower costs of GHG reductions since the other co-benefits would carry a share of the costs together with a change in the cost ranking of mitigation options ( Schlamadinger et al. 2006 [NPR, SRC] ).
The reduced costs of new technologies due to experience, and the incentives for further improvement due to competition, can be co-benefits of climate-change policies ( Jochem and Madlener, 2002 [NPR, ARC] ). New energy technologies are typically more expensive during their market-introduction phase but substantial learning experience can usually be achieved to reduce costs and enhance skill levels ( Barreto, 2001 [NPR, MoS] ;( Herzog et al., 2001; ) IEA, 2000 [NPR] ;( McDonald and Schrattenholzer, 2001; ) NCOE, 2004 [NPR] ). Increased net employment and trade of technologies and services are useful co-benefits given high unemployment in many countries. Employment is created at different levels, from research and manufacturing to distribution, installation and maintenance. Renewable-energy technologies are more labour-intensive than conventional technologies for the same energy output ( Kamman et al., 2004 [NPR] ). For example, solar PV generates 5.65 person-years of employment per 1 million US$ investment (over ten years) and the wind-energy industry 5.7 person-years. In contrast, every million dollars invested in the coal industry generates only 3.96 person-years of employment over the same time period ( Singh and Fehrs, 2001 [NPR] ). In South Africa, the development of renewable energy technologies could lead to the creation of over 36,000 direct jobs by 2020 ( Austin et al., 2003 [NPR] ) while more than 900,000 new jobs could be created across Europe by 2020 as a result of the increased use of renewable energy ( EUFORES, 2004 [NPR] ).
4.5.4 Implications of energy supply on sustainable development
The connection between climate-change mitigation and sustainable development is covered extensively in Chapter 12 . The impact of the mitigation efforts from the energy-supply sector can be illustrated using the taxonomy of sustainability criteria and the indicators behind it. An analysis of the sustainability indicators mentioned in 750 project design documents submitted for validation under the CDM up to the end of 2005 ( Olsen and Fenhann, 2006 [NPR, SRC] ) indicated renewable energy projects provide the most sustainable impacts. Examples include biomass energy to create employment; geothermal and hydro to give a positive balance of payment; fossil-fuel switching to reduce emissions of SO2 and NOx; coal bed methane capture to reduce the number of explosions/accidents; and solar PV to create improved and increased access to electricity, employment, welfare and better learning possibilities.
4.5.4.1 Health and environment
Energy interlinks with health in two contradictory ways. It is essential to support the provision of health services, but energy conversion and consumption can have negative health impacts ( Section 11.8 ). For example, in the UK, a lack of insufficient home heating has been identified as a principal cause of high levels of winter deaths (London Health Commission, 2003 ), but emissions from oil, gas, wood and coal combustion can add to reduced air quality and respiratory diseases.
The historical dilemma between energy supply and health can be demonstrated for various sectors, although it should be noted that recent times have seen major improvements. For instance, whereas epidemiological studies have shown that oil production in developed countries is not accompanied by significant health risks due to application of effective abatement technology, a Kazakhstan study compared the health costs between the city of Atyrau (with a high rate of pollution from oil extraction) and Astana (without). Health costs per household in Atyrau were twice as high as in Astana. The study also showed that the annual benefits of investments in abatement technologies were at least five times higher than the virtual annual abatement costs. A key barrier to investment in abatement technologies was the differentiated responsibility, as household health costs are borne by individuals, while the earnings from oil extraction accrue to the local authorities ( (Netalieva et al., 2005 ) ).
Accidental spills during oil-product transportation are damaging to the environment and health. There have been many spills at sea resulting in the destruction of fauna and flora, but the frequency of such incidents has declined sharply in recent times ( Huijer, 2005 [NPR] ). There are also spills originating from cracks in pipelines due to failure or sabotage. For example, it was estimated that the trans-Ecuadorian pipeline alone has spilt 400,000 litres of crude oil since it opened in 1972 . Spills at oil refineries are also not uncommon. Verweij 2003 [NPR] ) reported that in South Africa more than one million litres of petrol leaked from the refinery pipeline systems into the soil in 2001, thus contaminating ground water. One of the most recent oil spills occurred in Nanchital, Mexico in December 2004, where it was estimated that 5000 barrels of crude oil spilled from the pipeline with much of it going into the Coatzacoalcos River. Pemex, the company owning the pipeline, indicated a willingness to compensate the more than 250 local fishermen and the owners of the 200 hardest-hit homes. Coal mining is also hazardous with many thousands of fatalities each year. Exposure to coal dust has also been associated with accelerated loss of lung function ( (Beeckman and Wang, 2001 ) ).
4.5.4.2 Equity and shared responsibility
Economies with a high dependence on oil exports tend to have a poorer economic performance ( Leite and Weidmann, 1999 [NPR] ). The local energy needs of the host countries may be overlooked by their governments in the quest for foreign earnings from energy exports. Inadequate returns to the energy resource-rich communities have resulted in organized resistance against oil-extraction companies. Insecurities associated with oil supplies also result in high military expenditure as shown by OPEC countries ( Karl and Gary, 2004 [NPR] ).
The advent of reform in the energy sector increases inequalities. Notably electricity tariffs have generally shifted upwards after commencement of reforms ( Wamukonya, 2003 [NPR, SRC] ; Dubash, 2003 [NPR] ) making electricity even more inaccessible to the lower-income earners. There are many genuine efforts to address such issues (World Bank, 2005 [NPR] ), although much still needs to be done (Lort-Phillips and Herringshaw, 2006 ). Companies whose origin countries have stringent mandatory disclosure requirements are reported to perform best on transparency. Public private partnerships in developing countries are starting to make inroads into the issue of inequity and to harmonize practices between the developed and developing world. One such example is the Global Gas Flaring Reduction Partnership (World Bank, 2004a [NPR] ) aimed at reducing wasteful flaring and conserving the hydrocarbon resources for utilization by the host country.
4.5.4.3 Barriers to providing energy sources for sustainable development
The high investment cost required to build energy-system infrastructure is a major barrier to sustainable development. The IEA 2004a [NPR] ) estimated that 5 trillion US$ will be needed to meet electricity demand in developing countries by 2030 . To meet all the eight Millennium Development Goals will require an annual average investment of 20 billion US$ to develop energy infrastructure and deliver energy services ( UNDP, 2004b [NPR] ). Access to finance for investment in energy systems, especially in developing countries, has, nonetheless, been declining.
Available infrastructure also dictates energy types and use patterns. For instance, in a study on Peruvian household demand for clean fuels, Jack 2004 [NPR] ) found that urban dwellers were more likely to use clean fuels than rural householders, due to the availability of the necessary infrastructure. Investment costs necessary to capture natural gas and divert it into energy systems and curb flaring and venting are a barrier, even though efforts are being made to overcome this problem (World Bank, 2004a [NPR] ). It is estimated that over 110 billion m3 of natural gas are flared and vented worldwide annually, equivalent to the total annual gas consumption of France and Germany ( ESMAP, 2004 [NPR] ).
Levels of investment vary across regions, with the most needy receiving the least resources. Between 1990 and 2001, private investments to developing and transition countries for power projects were about 207 billion US$. Nearly 43% went to Latin America and the Caribbean, 33% to East Asia and the Pacific and approximately 1.5% to sub-Saharan Africa ( Kessides, 2004 [NPR] ). Accessibility and affordability of clean fuels remains a major barrier in many developing countries, exacerbated when complex supply systems are required that lead to high transaction costs.
Corruption, bureaucracy and mismanagement of energy resources have often prevented the use of proceeds emanating from extraction of energy resources from being used to provide local energy systems to meet sustainable development needs. Forms of corruption have encompassed such schemes as:
- the granting of lucrative power purchase agreements (PPAs) by politicians, who then benefit from receiving a share of guaranteed prices considerably higher than the international market price (Shorrock, 2002; Vallete and Wysham, 2002);
- suspending plant operations, thereby compromising access to electricity and persuading government agencies to pay high premiums for political risk insurance (Hall and Lobina, 2004); and
- granting of lucrative sole-supplier trading rights for gas supplies (Lovei and McKechnie, 2000).
Oil-backed loans have contributed to high foreign debts in many oil-producing countries at the expense of the poor majority ( IMF, 2001 [NPR] ; Global Witness, 2004 [NPR] ). Despite heavy debts, such countries continue to sign for such loans ( AEI, 2003 [NPR] ) and potential revenues are used as collateral to finance government external debt rather than to reduce poverty or promote sustainable development. These loans are typically provided at higher interest rates than conventional concessionary loans (World Bank, 2004b [NPR] ) and so the majority of the local population fail to benefit from high oil prices ( IRIN, 2004 [NPR] ). The problem could be overcome by legal frameworks that enable the channelling of revenue into investments that provide energy systems and promote sustainable development in communities affected by energy-resource extraction. In the meantime, the problem remains a key barrier to sustainable development and, although several countries including Peru, Nigeria and Gabon have mandated enabling mechanisms for such transfers, progress in implementing these measures has been slow ( Gary and Karl, 2003 [NPR] ).
Poor policies in the international financing sector hinder the establishment of energy systems for sustainable development. A review of the extractive industries (World Bank, 2004b [NPR] ), for example, revealed that the World Bank group and the International Finance Corporation (IFC) have been investing in oil- and gas-extractive activities that have negative impacts on poverty alleviation and sustainable development. The review, somewhat controversially, recommended that the banks should pull out of oil, gas and coal projects by 2008 .
Population growth and higher per-capita energy demand are forcing the transition of supply patterns from potentially sustainable systems to unsustainable ones. Efficient use of biomass can reduce CO2 emissions, but can only be sustained if supplies are adequate to satisfy demand without depleting carbon stocks by deforestation ( Section 4.3.3.3 ). If supplies are inadequate, it may be necessary to shift demand to fossil fuels to prevent overharvesting. In Niger, for example, despite the concerted efforts through a long-term World Bank funded project, it is not possible to provide sufficient woody biomass on a sustainable basis. As a result, the government has launched a campaign to encourage consumers, particularly industry, to shift from wood to coal and has re-launched a 3000 t/yr production unit, distributed 300 t of coal to Niamey, and produced 3800 coal-burning stoves ( ISNA, 2004 [NPR] ). Further, in the electricity sector, PPAs that are not favourable to the establishment of generation plants that promote sustainable development are increasingly common. These include long-term PPAs with payments made in foreign currency denominations, leaving the power sector extremely vulnerable to macro-economic shocks as demonstrated by the 1998 Asian crisis ( Wamukonya, 2003 [NPR, SRC] ).
4.5.4.4 Strategies for providing energy for sustainable development
Although the provision of improved energy services is not mentioned specifically in the formal Millennium Development Goals (MDGs) framework, it is a vital factor. Electrification and other energy-supply strategies should target income generation if they are to be economically sustainable. It is important to focus on improving productive uses of energy as a way of contributing to income generation by providing services and not as an end in themselves. It has been argued that the traditional top-down approaches to reform the power sector – motivated by macroeconomic factors and not aimed at improving access for the poor – should be replaced by bottom-up ones with communities at the centre of the decision process ( GNESD, 2006 [NPR] ).
Sea-level rise, tropical cyclones and large ocean waves may hamper offshore oil and gas exploration and extraction of these fossil fuels. Higher ambient temperatures may affect the efficiency and capacity ratings of fossil-fuel-powered combustion turbines. In addition, electricity transmission losses may increase due to higher ambient temperatures. Renewable-energy systems may be adversely affected ( Sims, 2003 [SRC] ), for example if solar power generation and water heating are impacted by increased cloud cover. Lower precipitation and higher evaporation due to higher ambient temperatures may cause lower water levels in storage lakes or rivers that will affect the outputs of hydro-electric power stations. Energy crop yields could be reduced due to new pests and weather changes and more extreme storm events could damage wind turbines and ocean energy devices. The need to take measures to lessen the impacts on energy systems resulting from their intrinsic vulnerability to climate change will remain a challenge for the foreseeable future.
4.5.5 Vulnerability and adaptation
It is essential to look at how the various components of the energy-supply chain might be affected by climate change. At the same time, it is desirable to assess current adaptation measures and their adequacy to handle potential vulnerability. A robust predictive skill is required to ensure that any mitigation programmes adopted now will still function adequately if altered climatic conditions prevail in the future.
Official aid investments in developing countries are often more focused on recovery from disaster than on the creation of adaptive capacity. Lending agencies and donors will need to reform their investment policies accordingly to mitigate this problem ( Monirul, 2004 [NPR] ). Many developing countries are particularly vulnerable to extremes of normal climatic variability that are expected to be exacerbated by climate change. Assessing the vulnerability of energy supply to climatic events and longer-term climate change needs to be country- or region-specific. The magnitude and frequency of extreme weather events such as ice storms, tornadoes and cyclones is predicted to change, as may annual rainfall, cloud cover and sunshine hours. This is likely to increase the vulnerability of the various components of the energy-supply infrastructure such as transmission lines and control systems.
4.5.6 Technology Research, Development, Demonstration, plus Deployment (RD3)
Future investments in RD3 will, in part, determine:
- future security of energy supplies;
- accessibility, availability and affordability of desired energy services;
- attainment of sustainable development;
- free-market distribution of energy supplies to all countries;
- deployment of low-carbon energy carriers and conversion technologies;
- the quantities of GHGs emitted for the rest of this century; and
- achievement, or otherwise, of GHG stabilization concentration levels.
Technology can play an important role in reducing the energy intensity of an economy ( (He and Zhang, 2006; ) He et al., 2006 [Ambiguous] ). In addition to new and improved energy-conversion technologies, such concepts as novel supply structures, distributed energy systems, grid optimization techniques, energy transport and storage methods, load management, co-generation and community-based services will have to be developed and improved ( Luther, 2004 [NPR] ). The knowledge base required to transform the energy supply and utilization system will then need to be created and expanded.
Major innovations that will shape society will require a foundation of strong basic research Friedman,Major innovations that will shape society will require a foundation of strong basic research Friedman,). Areas of generic scientific research in material-, chemical-, bio-, and geo-sciences that could be particularly important to energy supply need to be reviewed. Progress in basic research could lead to new materials and technologies that can radically reduce costs or reveal new approaches to providing energy services. For example, the development of fibre optics from generic research investment resulted in their current use to extract greater volumes of oil or gas from a reservoir than had been previously possible.
Cross-disciplinary collaborations between many scientific areas, including applied research and social science, are needed for successful introduction of new energy supply and end-use technologies necessary to combat the unprecedented challenge of supporting human growth and progress while protecting global and local environments. Integrating scientific progress into energy and environmental policies is difficult and has not always received the attention it deserves ( IEA, 2003a [NPR] ). Successful introduction of new technologies into the market requires careful coordination with governments to encourage, or at least not to hinder, their introduction. There is no single area of research that will secure a reliable future supply of energy. A diverse range of energy sources will be utilized and hence a broad range of fundamental research will be needed. Setting global priorities for technology development should be based on quantitative assessments of possible emissions and their abatement paths, but guidelines would first need to be developed ( OECD, 2006a [NPR] ).
4.5.6.1 Public and private funding
Almost all (98%) of total OECD energy R&D investment has been by only ten IEA member countries ( Margolis and Kammen, 1999 [JoC] ; WEC, 2001 [NPR] ). The amount declined by 50% between the peak of 1980 (following the oil price shocks) and 2002 in real terms ( Figure 4.32 ). Expenditure on nuclear technologies, integrated over time, has been many times higher than investment in renewable energies. The end of the cold war and lower fossil-fuel prices decreased the level of public attention on energy planning in the 1980 s, and global energy R&D investment has yet to return to these levels despite growing concerns about energy security and climate change ( Chapter 13 ).
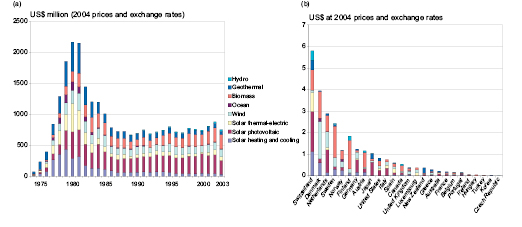
Figure 4.32: IEA member government budgets for total renewable energy R&D annual investments for 1974 – 2003 (left, a) and investment per capita, averaged between 1990 and 2003 (right, b).
Ultimately, it is only by creating a demand-pull market (rather than supply-push) that technological development, learning from experience, economies of scale in production and related cost reductions can result. As markets expand and new industries grow (the wind industry for example), more private investment in R&D results, which is often more successful than public research ( Sawin, 2003b [NPR, MoS] ).
The private sector invests a significant amount in energy RD3 to seek competitive advantage through improved technology and risk avoidance in relation to commercialization. Firms tend to focus on incremental technology improvements to gain profits in the short term. R&D spending by firms in the energy industry is particularly low with utilities investing only 1% of total sales in US, UK and the Netherlands compared with the 3% R&D-to-sales ratio for manufacturing, and up to 8% for pharmaceutical, computer and communication industries.
If government policies relating to strategic research can ensure long-term markets for new technologies, then industries can see their potential, perform their own R&D and complement public research institutions ( Luther, 2004 [NPR] ). Fixed pricing laws to encourage the uptake of new energy-supply technologies have been successful but do not usually result in novel concepts. Further innovation is encouraged once manufacturers and utilities begin to generate profits from a new technology. They then invest more in R&D to lower costs and further increase profit margins ( (Menanteau et al., 2003 ) ). Under government mandatory quota systems (as used to stimulate renewable energy projects in several countries – Section 4.5.1 ), consumers tend to benefit the most and hence producers receive insufficient profit to invest in R&D.
Recent trends in both public and private energy RD3 funding indicate that the role of ‘technology push’ in reducing GHG emissions is often overvalued and may not be fully understood. Subsidies and externalities (both social and environmental) affect energy markets and tend to support conventional sources of energy. Intervention to encourage R&D and adoption of renewable energy technologies, together with private investment and the more intelligent use of natural and social sciences is warranted ( (Hall and Lobina, 2004 ) ). Obtaining a useful balance between public and private research investment can be achieved by using partnerships between government, research institutions and firms.
Current levels of public and private energy-supply R&D investment are unlikely to be adequate to reduce global GHG emissions while providing the world with the energy needs of the developing nations ( Edmonds and Smith, 2006 [NPR, ARC] ). Success in long-term energy-supply R&D is associated with near-term investments to ensure that future energy services are delivered cost-effectively and barriers to implementation are identified and removed. Sustainable development and providing access to modern energy services for the poor have added challenges to R&D investment ( IEA, 2004a [NPR] ; IEA 2006a [NPR] ; Chapter 13 ).
REFERENCES
AEI, 2003: $1.15 billion oil backed fresh cash, Africa Energy Intelligence. American Enterprises Institute for public policy research, Washington D.C. [NPR]
Andrews, S. and R. Udal, 2003: Oil prophets: looking at world oil studies over time. Association for Study of Peak Oil Conference, Paris. [NPR]
ANSTO, 2006: Australia’s possible role in the nuclear fuel cycle, ANSTO´s submission to the uranium mining, processing and nuclear energy review, < http://www.pmc.gov.au/umpner/submissions/211_sub_umpner.pdf > accessed 05/06/07. [NPR]
Archer, C.L. and M.Z. Jacobsen, 2005: Evaluation of global wind power. Journal of Geophysical Research, 110(D12110), doi:10.1029/2004JD005462. [JoC]
Aringhoff, R., C. Aubrey, G. Brakmann, and S. Teske, 2003: Solar thermal power 2020, Greenpeace International/European Solar Thermal Power Industry Association, Netherlands. [NPR]
Austin, G., A. Williams, G. Morris, R. Spalding-Feche, and R. Worthington, 2003: Employment potential of renewable energy in South Africa. Earthlife Africa, Johannesburg and World Wildlife Fund (WWF), Denmark, November, 104 pp. [NPR]
Awerbuch, S. and R. Sauter, 2005: Exploiting the oil-GDP effect to support renewables deployment. Paper No. 129, SPRU Electronic Working Paper Series, < http://www.sussex.ac.uk/spru/ > accessed 05/06/07. [NPR]
Bakker, M., H.A. Zondag, M.J. Elswijk, K.J. Strootman, and M.J.M. Jong, 2005: Performance and costs of a roof-sized PV/thermal array combined with a ground coupled heat pump. Solar Energy, 78, pp. 331-339. Clean
Bailis, R., M. Ezzati, and D.M. Kammen, 2005: Mortality and greenhouse gas impacts of biomass and petroleum energy futures in Africa. Science, 308(5718), pp. 98-103. [JoC, MoS]
Barreto, L., 2001: Technological learning in energy optimisation models and deployment of emerging technologies. PhD thesis, Swiss Federal Institute of Technology, Zurich, Switzerland. [NPR, MoS]
Beeckman, L.A. and M.L. Wang, 2001: Rapid declines in FEVI and subsequent respiratory symptoms, illness and mortality in coal miners in the United States. American Journal of Respiratory and Critical Care Medicine, 163(3 Pt 1), pp. 633-639. Clean
Beg, N., 2002: Ancillary benefits and costs of GHG mitigation: policy conclusion. Publication Service, OECD, Paris, France, 43 pp. [NPR]
Bendtsen, B., 2003: Parliamentary answer to question S4640, Danish Parliament, September 2, < http://www.ft.dk/Samling/20021/spor_sv/S4640.htm > accessed 05/06/07. [NPR]
Bentley, R.W., 2002a: Oil forecasts past and present. Energy Exploration and Exploitation, 20(6), pp. 481-492. [MoS]
Bentley, R.W., 2002b: Global oil and gas depletion: an overview. Energy Policy, 30, pp. 189-205. Clean
Bentley, R.W., 2005: Global oil depletion - methodologies and results. 4th International Workshop on oil depletion. Lisbon, May 2005. [NPR]
Bertani, R., 2005: Worldwide geothermal generation 2001-2005 state of the art. Proceedings of the World Geothermal Congress 2005: April, Antalya, Turkey. [NPR]
BIREC, 2005: Beijing International Renewable Energy Conference, Beijing, November, < www.birec.ch > accessed 05/06/07. [NPR]
Bohm, M.C., 2006: Capture-ready power plants - Options, technologies and economics, MSc Thesis, MIT. < http://sequestration.mit.edu/pdf/Mark_Bohm_Thesis.pdf > , accessed 05/06/07. [NPR]
BP, 2004: Statistical review of world energy, BP Oil Company Ltd., London. < www.bp.com/subsection.do?categoryId=95 & contentId=2006480 > accessed 05/06/07. [NPR]
BP, 2005: BP Statistical Review of world energy. BP Oil Company Ltd., London. [NPR]
BP, 2006: BP Statistical review of world energy. BP Oil Company Ltd., London. < www.bp.com > accessed 05/06/07. [NPR]
Bradshaw, J., S. Bachu, D. Bonijoly, R. Burruss, S. Holloway, N.P. Christentssen, and O.M. Mathiassen, 2006: CO2 storage capacity estimation: issues and development of standards. Paper at the 8th Greenhouse gas technologies conference, June 19-22, 2006: Trondheim, Norway. [NPR, MoS]
Brendow, K., 2004: World coal perspectives to 2030. World Energy Council, Geneva and London. [NPR]
Broek, R. van den, 2000: Sustainability of biomass electricity systems - An assessment of costs, macro-economic and environmental impacts in Nicaragua, Ireland and the Netherlands. PhD Thesis, Utrecht University, 215 pp. [NPR]
Bromley, C.J. and S. Currie, 2003: Analysis of subsidence at Crown Road, Taupo: a consequence of declining groundwater. Proceedings of the 25th New Zealand Geothermal Workshop, Auckland University, pp. 113-120. [NPR]
Bruce, N., R. Perez-Padilla, and R. Albalak, 2000: Indoor air pollution in developing countries: a major environmental and public health challenge. Bulletin of the World Health Organization, 78, Geneva, Switzerland, pp. 1078-1092. Clean
BTM, 2006: World Market Update 2005: International wind energy development status by end of 2005 and Forecast 2006-2010, BTM Consult, Aps, Denmark, <www.btm.dk> accessed 05/06/07. [NPR, MoS]
Burtraw, D. and M. Toman, 2000: Ancillary benefits of greenhouse gas mitigation policies. Climate Change Issues Brief, 7, Resources for the Future, Washington DC [NPR, MoS]
CAPP, 2006: Canadian Association of Petroleum Producers, < www.capp.ca/raw.asp?x=1 & dt=NTV & e=PDF & dn=103586 > accessed 05/06/07. [NPR]
Carbon Trust, 2005: Marine energy challenge. < www.carbontrust.co.uk > accessed 05/06/07. [NPR]
Chae, Y. and C. Hope, 2003: Integrated assessment of CO2 and SO2 policies in North East Asia. Climate Policy, 3, Supplement 1, pp. S57-S79. [JoC]
Chen, W., 2005: The costs of mitigating carbon emissions in China: findings from China MARKAL-MACRO modeling. Energy Policy, 33, pp. 885-896. [MoS, ARC]
CIEP, 2004: Study on energy supply security and geopolitics. Final report, Clingendael International Energy Programme, Institute for International Relations ‘Clingendael’, The Hague, The Netherlands. [NPR]
Cleland, D., 2005: Sustainable energy use and management, Proceedings of the conference; People and Energy - how do we use it? Christchurch, Royal Society of New Zealand, Miscellaneous series, 66, pp. 96-102. [NPR]
CSY, 2005: China Statistical Yearbook, National Bureau of Statistics of China. [NPR]
Collier, U., 2006: Meeting Africa’s energy needs - the costs and benefits of hydro power, Worldwide Fund for Nature, Oxfam and Wateraid joint report < http://allafrica.com/stories/200603060496.html > accessed 05/06/07. [NPR]
Cook, I., N. Taylor, D. Ward, L. Baker, and T. Hender, 2005: Accelerated development of fusion power. Report UKAEA FUS521, EURATOM/UKAEA. [NPR]
CSIRO, 2005: Coal preparation, ultra clean coal. < http://www.det.csiro.au/science/lee_cc/ultra_clean_coal.htm > assessed 08/08/07. [NPR]
Danish Energy Authority, 2005: Technology data for electricity and heat generation plants, < http://www.ens.dk/graphics/Publikationer/Forsyning_UK/Technology_Data_for_Electricity_and_Heat_Generating_Plants/index.htm > accessed 05/06/07. [NPR]
Datta, K.E., T. Feiler, K.R. Rábago, N.J. Swisher, A. Lehmann, and K. Wicker, 2002: Small is profitable. Rocky Mountain Institute, Snowmass, Colorado, ISBN 1-881071-07-3. < www.rmi.org > , accessed 05/06/07. [NPR]
de Moor, A., 2001: Towards a grand deal on subsidies and climate change. Journal Natural Resources Forum, 25(2), May. Clean
Dellero, N. and F. Chessé, 2006: New nuclear plant economics. IYNC 2006 conference paper 234, Stockholm, Sweden - Olkiluoto, Finland, 18-23 June, AREVA, World Nuclear Association, < http://www.world-nuclear.org/info/inf63.htm > accessed 05/06/07. [NPR]
Delmas, R., 2005: Long term greenhouse gas emissions from the hydroelectric reservoir of Petit Saut (French Guiana) and potential impacts. Global Warming and Hydroelectric Reservoirs, CDD 363.73874, pp. 117-124. [NPR]
DGEMP, 2006: Radioactive Materials and Waste, Planning Act of 28 June 2006, National Policy for the Sustainable Management of Radioactive Materials and Waste. Direction generale de l’énergie et des matieres primaires (DGEMP), France. [NPR]
DME, 2003: White paper on renewable energy. Department of Minerals and Energy, Pretoria, South Africa. [NPR]
Dones, R, T. Heck, M. Faist Emmenegger, and N. Jungbluth, 2005: Life cycle inventories for the nuclear and natural gas energy systems, and examples of uncertainty analysis. International Journal LCA, 10(1), pp. 10-23. Clean
dos Santos, A.M, L.P. Rosaa, B. Sikard, E. Sikarb, and E.O. dos Santos, 2004: Gross greenhouse gas fluxes from hydro-power reservoirs compared to thermal power plants. aIVIG/COPPE/UFRJ and Energy Planning Program/COPPE/UFRJ, University of Grande Rio and University of Sao Paulo, Sao Carlos, Brazil. [NPR]
dos Santos, M.A. (ed.), 2005: Carbon budget in tropical reservoirs. Global Warming and Hydroelectric Reservoirs, CDD 363.73874, pp 95-100. Clean
Dooley, J.J., R.T. Dahowski, C.L. Davidson, S. Bachu, N. Gupta and J. Gale, 2005: IEA greenhouse gas programme. Proceedings of 7th International Conference on Greenhouse Gas Control Technologies, Volume 1: Peer-Reviewed Papers and Plenary Presentations (E.S. Rubin, D.W. Keith and C.F. Gilboy, eds.), Cheltenham, UK, < http://www.ghgt7.ca > accessed 02/07/07 [NPR]
Dow Jones, 2006: Kratwerk mit pilotanlage fur CO2 abscheidung in Beitrib. Dow Jones Trade News Emissions, 19 May, 10, 11 pp. Clean
DTI, 1999: Coal liquefaction - technology status report. Department of Trade and Industry, London, UK. [NPR]
Dubash, N.K., 2003: Revisiting electricity reform: the case for a sustainable development approach, Utilities Policy, 11, pp. 143-154 [NPR]
Duncan, A., 2005: Solar building developments. Master Applied Science thesis, Massey University Library, Palmerston North, New Zealand. [NPR]
EC, 2005: The support of electricity from renewable energy sources. European Commission COM(2005) 627 final, Brussels, 50 pp. [NPR]
EC, 2007: World energy technology outlook 2050 (WETO-H2) Report. Directorate-General for Research, European Commission, January, < http://ec.europa.eu/research/energy/gp/gp_pu/article_1100_en.htm > accessed 05/06/07. [NPR, 2007]
Edmonds, J. and S. Smith, 2006: The technology of two degrees, ‘Avoiding Dangerous Climate Change’. H.J. Schellenhuber, W. Cramer, N. Nakicenovic, T. Wrigley, and G. Yohe (eds), Cambridge University Press, pp. 385-391. [NPR, ARC]
EDUCOGEN, 2001: A guide to cogeneration, produced under the auspices of Contract N° XVII/4.1031/P/99-159. The European Association for the Promotion of Cogeneration, 51 pp. < www.cogen.org > accessed 05/06/07. [NPR]
EEA, 2004: Energy subsidies in the European Union - a brief overview. European Environment Agency, Technical report, Office for Official Publications of the European Communities, Luxembourg, 20 pp. [NPR]
EERE, 2005: A national vision of America’s transition to a hydrogen economy - to 2030 and beyond. <http:/www.eere.energy.gov/hydrogenandfuelcells/annual_report.html> accessed 05/06/07. [NPR]
EIA/DOE, 2005: Energy Information Administration, U.S. Department of Energy < www.eia.doe.gov/cabs/World_Oil_Transit_Chokepoints/Hormuz.html > and < www.eia.doe.gov/cabs/World_Oil_Transit_Chokepoints/Malacca.html > accessed 05/06/07. [NPR]
EIA/DOE, 2006: International Energy Outlook 2006. < www.eia.doe.gov/oiaf/ieo/index.html > accessed 05/06/07. [NPR]
Encyclopaedia of Energy, 2004: C.J. Cleveland (ed.), Elsevier Academic Press, Oxford. 4, pp. 257-272. Clean
Enerdata, 2004: A global energy data base including OECD data. Grenoble, France. [NPR]
Energy Policy Act, 2005: http://energycommerce.house.gov/ accessed 05/06/07. [NPR]
Environment California, 2006: < www.environmentcalifornia.org/newsroom/energy/energy-program-news/million-solar-roofs-bill-sb-1-signed-into-law#1H202IC_O9f0derEDnExjw > accessed 05/06/07. [NPR]
EPA, 2003: SF6 emissions reduction partnership for electric power systems. 2002 Partnership Report, < http://www.epa.gov/highgwp/electricpower-sf6/pdf/2002-partnership-report.pdf > accessed 05/06/07. [NPR]
EPA, 2005a: Energy Star. Environmental Protection Agency, < http://www.energystar.gov/ > accessed 05/06/07. [NPR]
EPA, 2005b: Natural gas star program. Environmental Protection Agency, < http://www.epa.gov/gasstar/ > accessed 05/06/07. [NPR]
EPA, 2005c: Coalbed methane outreach program. Environmental Protection Agency, < http://www.epa.gov/cmop/ > accessed 05/06/07. [NPR]
EPRI, 2003: Electricity technology roadmap, 2003 summary and synthesis. Report No.1010929, Electric Power Research Institute, Palo Alto, California, USA. [NPR]
Equitech, 2005: Equitech International. LLC, < http://www.equitechllc.com/papers/carbonemissions.html > accessed 05/06/07. [NPR]
ERC, 2004: Solar electrification by the concession approach in the rural Eastern Cape; Phase 2 monitoring survey November 2003: < www.erc.uct.ac.za > accessed 05/06/07. [NPR]
ESMAP, 2004: Regulation of associated gas flaring and venting: a global overview and lessons from international experience. Energy Sector Management Assistance Programme (ESMAP) report 285/04, World Bank, Washington D.C. [NPR]
ESTIA, 2004: Exploiting the heat from the sun to combat climate change. European Solar Thermal Industry Association and Greenpeace, Solar Thermal Power 2020, UK. [NPR]
EU, 2001: Promotion of electricity from renewable energy sources in the internal electricity market. Directive 2001/77/EC of the European Parliament and of the Council, Official Journal of the European Communities, 27 October, pp. 33-40. Clean
EU, 2003: Directive 2003/30/EC of the European Parliament and of the Council on the promotion of the use of biofuels or other renewable fuels for transport. Official Journal of the European Communities, 17.5.2003: pp. 42-46. [NPR]
EU, 2005: Externalities of energy: extension of accounting framework and policy applications (ExternE-Pol). Final Report of project, < http://www.externe.info/expoltec.pdf > accessed 05/06/07. [NPR]
EUFORES, 2004: The impact of renewables on employment and economic growth. European Commission ALTENER program, < http://www.eufores.org/ > accessed 05/06/07. [NPR]
EWEA, 2004: Wind energy - the facts - an analysis of wind energy in the EU-25. European Wind Energy Association, Brussels. [NPR]
EWEA, 2005: Large scale integration of wind energy in the European power supply system: analysis, issues and recommendations. < http://www.ewea.org/fileadmin/ewea_documents/documents/publications/grid/051215_Grid_report_summary.pdf > accessed 05/06/07. [NPR]
EEA, 2005: Greenhouse gas emission trends and projections in Europe 2005: European Environment Agency. < http://reports.eea.eu.int > accessed 05/06/07. [NPR, MoS]
FACTS Inc., 2005: Gas data book: Asia-Pacific natural gas & LNG. Honolulu, Hawaii. [NPR]
Fearnside, P.M., 2004: Greenhouse gas emissions from hydroelectric dams: controversies provide a springboard for rethinking a supposedly clean energy source: Editorial Comment. Climatic Change, 66, pp. 1-2. [JoC]
Fisher, B., 2006: Industry related technology research. Proceedings of the Expert Review Meeting, Intergovernmetnal Panel on Climate Change (IPCC) WG III, Capetown, 17-19 January. [NPR, ARC]
Fouquet, D., C. Grots, J. Sawin, N. Vassilakos, 2005: Reflections on a possible unified EU financial support scheme for renewable energy systems (RES): a comparison of minimum-price and quota systems and an analysis of market conditions. Brussels and Washington D.C., January 2005, 26 pp. [NPR]
Friedman, 2003: Will innovation flourish in the future? The Industrial Physicist, January, pp. 22-25. [NPR]
Gary, I. and T.L. Karl, 2003: Bottom of the barrel: Africa oil boom and the poor. Report Catholic Relief Services, Baltimore MD, 110 pp. [NPR]
Gehl, S., 2004: Generation technology choices: near and long term. US DOE/EPRI Annual Energy Outlook Conference, Washington D.C., www.eia.doe.gov/oiaf/archive/aeo04/conf/pdf/gehl.pdf [NPR, SRC]
accessed 05/06/07.
Gibbins, J., S. Haszeldine, S. Holloway, J. Pearce, J. Oakey, S. Shackley, and C. Turley, 2006: Scope for future CO2 emission reductions from electricity generation through the deployment of carbon capture and storage technologies. In Avoiding Dangerous Climate Change, H.J. Schellnhuber (ed.), Chapter 40, Cambridge University Press, ISBN: 13 978-0-521-86471-8 hardback, ISBN: 10 0-521-86471-2 paperback, 379 pp. <http://www.defra.gov.uk/environment/climatechange/research/dangerous-cc/index.htm> accessed 05/06/07. [NPR]
Giebel, G., 2005: Wind power prediction using ensembles. Risø National Laboratory, ISBN 87-550-3464-0, September, 43 pp. [NPR, MoS]
GIF, 2002: Technology roadmap for generation IV nuclear energy systems. US DOE Nuclear Energy Research Advisory Committee and the Generation IV International Forum (GIF), December. < http://gif.inel.gov/roadmap/pdfs/gen_iv_roadmap.pdf > accessed 05/06/07. [NPR]
GGFR, 2004: Global gas flaring reductions - a public/private partnership. Report number 6, September. [NPR]
Global Witness, 2004: Global policy forum (GPF), New York USA, < http://www.globalpolicy.org/ > accessed 05/06/07. [NPR]
GNESD, 2006: Electricity and development in Africa, Asia and Latin America. Consolidated Report of regional workshop on Global Network on Sustainable Development (GNESD), January, < www.gnesd.org/Downloadables/GnesdRegionalWorkshop.pdf > accessed 05/06/07. [NPR]
Goldemberg, J., 2004: The case for renewable energies. Thematic background paper, International Conference for Renewable Energies, Bonn, June, <www.renewables2004.de> accessed 05/06/07. [NPR]
Goldemberg, J. and T.B. Johansson, 2004: World Energy Assessment; Overview 2004 update. United Nations Development Programme, USA, 88 pp. [NPR]
Goldemberg, J., T.B. Johansso, A.K.N. Reddy, and R.H. Williams, 2004: A global clean cooking fuel initative. Energy for Sustainable Development, 8(3), pp. 5-12. Clean
Greenpeace, 2006: Solar generation. K. McDonald (ed.), Greenpeace International, Amsterdam. [NPR]
Greenfuels, 2004: Greenfuels Technology Corp. announces first field results from MIT Cogeneration plant beta test site. CK Test report, < http://www.greenfuelonline.com/gf_files/CK_Test_Report.pdf > accessed 05/06/07. [NPR]
Greenshift, 2005: Greenshift acquires rights to patented carbon dioxide reduction technology. < http://www.greenshift.com/news.php?id=97 > accessed 05/06/07. [NPR]
Greenpeace, 2004: http://www.greenpeace.org.ar/cop10ing/SolarGeneration.pdf accessed 05/06/07. [NPR]
Gul, T., and T. Stenzel, 2005: Variability of wind power and other renewables - management options and strategies. International Energy Agency working paper, OECD/IEA, Paris. [NPR]
GWEC, 2006: Global wind energy outlook. Global Wind Energy Council, Bruxelles and Greenpeace, Amsterdam, September, 56 pp., < www.gwec.net > accessed 05/06/07. [NPR]
Haas, R., 2002: Building PV markets: the impact of financial incentives. Journal Renewable Energy World, 5(4), pp. 184-201. Clean
Hagen, R.E, J.R. Moens, and Z.D. Nikodem, 2005: Impact of U.S. nuclear generation on greenhouse gas emissions. Energy Information Administration, U.S. Department of Energy, < http://tonto.eia.doe.gov/FTPROOT/nuclear/ghg.pdf > accessed 05/06/07. [NPR]
Hall, C., P. Tharakan, J. Hallock, C. Cleveland, and J. Jefferson, 2004: Hydrocarbons and the evolution of human culture. November, Nature, 426, pp. 318-322, <www.nature.com/nature> accessed 05/06/07. [JoC]
Hall, D.O., 2003: Electricity in Latin America. Public Services International Research Unit (PSIRU), London UK, 16 pp. [NPR]
Hall, D.O. and E. Lobina, 2004: Private and public interests in water and energy. Natural Resources Forum 28, pp. 286-277. Clean
Hallock, J.L, Tharakan P.J., C.A.S. Hall, M. Jefferson, and W. Wu, 2004: Forecasting the limits to the availability and diversity of global conventional oil supply. Energy, 29, pp. 1673-1696, Elsevier. [MoS]
He, J.K., A.L. Zhang, and C.S. Shang, 2006: Assessment of GHG mitigation using INET energy systems model. Journal of Tsinghua University, 36(10), pp. 68-73. [MoS]
He, J.K. and X.L. Zhang, 2006: Analysis of China’s energy consumption intensity reduction tendency during the 11th Five-Year-Plan period. China Soft Science, 184, pp. 33-38, April. Clean
Helynen, S., 2005: Distributed generation for sustainable development. Proceedings on Technologies for Sustainable Energy Development in the Long Term, L. Peterson and H. Larsen (eds.), Risoe-R-1517(EN), 459 pp., < www.risoe.dk/rispubl/SYS/ris-r-1517.htm > accessed 05/06/07. [NPR]
Hendriks, C., W. Graus and F. van Bergen, 2004: Global carbon dioxide storage potential. Ecofys, TNO, Utrecht, Netherlands. [NPR]
Herzog, A.V., T.E. Lipman, J.L. Edwards, and D.M. Kammen, 2001: Renewable energy: a viable choice. Environment, 43(10). Clean
Hirsch, R.L., R. Bezdek, and R. Wendling, 2005: Peaking of world oil production: impacts, mitigation, and risk management. Report to the American Administration, Washington D.C. [NPR]
Hondo, H., 2005: Life cycle GHG emission analysis of power generation system: Japanese case. Energy, 30, pp. 2042-2056. Clean
Huijer, K., 2005: Trends in oil spills from tanker ships 1995-2004: International Tanker Owners Pollution Federation (ITOPF). London. [NPR]
Huttunen, J., 2005: Long-term net methane release from Finnish hydro reservoirs. Global Warming and Hydroelectric Reservoirs, CDD 363.73874, pp. 125-127. Clean
Hydro Tasmania, 2005: Sustainable guidelines for hydro power developments. Produced by Hydro Tasmania for the International Hydro Power Association. [NPR]
IAEA, 1997: Joint convention on the safety of spent fuel management and on the safety of radioactive waste management. INFCIRC/546, 24 December 1997 (entered into force on 18 June 2001); < http://www.iaea.org/Publications/Documents/Infcircs/1997/infcirc546.pdf > accessed 05/06/07. [NPR]
IAEA, 1994: Convention on nuclear safety. International Atomic Energy Agency < http://www.iaea.org/Publications/Documents/Infcircs/Others/inf449.shtml > accessed 05/06/07. [NPR]
IAEA, 2005a: Thorium fuel cycle - potential benefits and challenges. International Atomic Energy Agency, Vienna 2005: <www-pub.iaea.org/MTCD/publications/PDF/TE_1450_web.pdf> accessed 05/06/07. [NPR]
IAEA, 2005b: Draft safety requirements: geological disposal of radioactive waste. Report no. WS-R-4, International Atomic Energy Agency, Vienna 2005, < http://www-pub.iaea.org/MTCD/publications/PDF/Pub1231_web.pdf > accessed 05/06/07. [NPR]
IAEA, 2005c: Energy, electricity and nuclear power estimates for the period up to 2030. Reference Data Series No.1, International Atomic Energy Agency, ISBN 92-0-1011-4289, July, Vienna, Austria. [NPR, MoS]
IAEA, 2006: Power reactor information system (PRIS). < http://www.iaea.org/programmes/a2/ > accessed 05/06/07. [NPR]
IEA, 2000: Experience curves for energy policy assessment. International Energy Agency, Paris, pp. 127. [NPR]
IEA, 2001: Impact of sustained high oil prices on developing countries. International Energy Agency Economic Analysis Division Working Party, Publication Service, OECD, Paris, France. [NPR]
IEA, 2003a: From oil crisis to climate challenge - understanding CO2 emission trends in IEA countries. International Energy Agency, OECD Publication Service, Paris, 22 pp. [NPR]
IEA, 2003b: Economies in transition, the IEA and renewable energy. Public Information Forum, International Energy Agency, Renewable Energy Working Party, Budapest, Hungary, OECD, Paris. < http://www.iea.org/dbtw-wpd/textbase/work/2003/budapest/background.pdf > accessed 05/06/07. [NPR]
IEA, 2003c: Energy to 2050: scenarios for a sustainable future. International Energy Agency, OECD, Paris. [NPR, MoS]
IEA, 2003d: Building the cost curves for the industrial sources of non-CO2 greenhouse gases. Greenhouse Gas R&D Programme, Report No. PH4/25, OECD, Paris, <www.iea.org> accessed 05/06/07. [NPR]
IEA, 2003e: Developments in the international coal market in 2001-2. Coal Industry Advisory Board, International Energy Agency, OECD, Paris, <http://www.iea.org/textbase/papers/2002/ciabmark.pdf> accessed 05/06/07. [NPR]
IEA, 2003f: National Survey Report of PV Power Applications in Japan 2002. Prepared by Kiyoshi Shino, Osamu Ikki, Tokyo, Japan, 27, International Energy Agency, Paris. [NPR]
IEA, 2003g: Proceedings of the seminar Towards Hydrogen - R & D priorities to create a hydrogen infrastructure. OECD, Paris. [NPR]
IEA, 2003h: Technology innovation, development and diffusion. Information paper, International Energy Agency, OECD, Paris. [NPR]
IEA, 2004a: World Energy Outlook 2004: International Energy Agency, OECD Paris. [NPR]
IEA, 2004b: Renewable energy - market and policy trends in IEA countries. International Energy Agency, OECD, Paris. <www.iea.org/textbase/nppdf/free/2004/renewable1.pdf> accessed 05/06/07. [NPR]
IEA, 2004c: Policies of IEA countries - 2004 review. International Energy Agency, Publication Service, OECD, Paris, 539 pp, < http://www.oecd.org/dataoecd/25/9/34008620.pdf > accessed 02/07/07. [NPR]
IEA, 2004d: Renewable Energy Working Party workshop Distributed generation- key issues, challenges, roles for its integration into mainstream energy systems, 1 March 2004: International Energy Agency, OECD, Paris. <www.iea.org> accessed 02/07/07. [NPR]
IEA, 2004e: Coming in from the cold - improving district heating policy in transition economies. International Energy Agency, OECD, Paris. [NPR]
IEA Bioenergy, 2005: Benefits of bioenergy. International Energy Agency, < http://www.ieabioenergy.com/library/179_BenefitsofBioenergy.pdf > accessed 02/07/07. [NPR]
IEA, 2005a: World Energy Outlook 2005: Middle East and North Africa Insights. International Energy Agency, OECD, Paris. [NPR]
IEA, 2005b: International Energy Agency, OECD, Paris, < http://www.iea.org/Textbase/stats/ > accessed 02/07/07. [NPR]
IEA, 2005c: Renewables information 2005. International Energy Agency, OECD Paris. [NPR]
IEA, 2005d: Energy to 2050: scenarios for a sustainable future. International Energy Agency, OECD Paris. [NPR, MoS]
IEA, 2005e: Resources to reserves: oil and gas technologies for the energy markets of the future. International Energy Agency, Paris (books@iea.org). [NPR, MoS]
IEA, 2005f: Hydrogen implementing agreement. International Energy Agency, OECD, Paris. [NPR]
IEA, 2005g: Prospects for hydrogen and fuel cells. International Energy Agency, OECD, Paris. [NPR]
IEA, 2006a : Global energy technology perspectives, International Energy Agency, OECD, Paris. < www.iea.org > accessed 02/07/07. [NPR]
IEA, 2006b: World energy outlook 2006. International Energy Agency, OECD Publication Service, OECD, Paris. < www.iea.org > accessed 02/07/07. [NPR]
IEA, 2006c: Key world energy statistics. < http://www.iea.org/textbase/nppdf/free/2006/key2006.pdf > accessed 02/07/07. [NPR]
IEA, 2006d: Renewable energy RD & D priorities report. International Energy Agency, OECD, Paris. < www.iea.org > accessed 02/07/07. [NPR]
IEA, 2006e: Policies and measures database. International Energy Agency, OECD, Paris, < www.iea.org > accessed 02/07/07. [NPR]
IEA, 2006f: Renewable energy heating and cooling. Seminar proceedings, April, International Energy Agency, OECD, Paris. < www.iea.org > accessed 02/07/07. [NPR]
IEA, 2006g : Contribution of renewables to energy security. Ölz S, Sims R E H and Kirchner N, Information report, International Energy Agency, OECD, Paris. <www.iea.org> [NPR]
IEA, 2006h: Bioenergy Implementing Agreement. International Energy Agency, OECD Paris, < http://www.joanneum.at/iea-bioenergy-task38/publications/faq/ > accessed 02/07/07. [NPR]
IEA, 2006j: Prospects for hydrogen and fuel cells. International Energy Agency, OECD, Paris. [NPR]
IEA/NEA, 2005: Projected costs of generating electricity - 2005 update. Joint Report, Nuclear Energy Agency and International Energy Agency, IEA/OECD, Paris. [NPR]
IEEJ, 2005: Handbook of energy & economic statistics in Japan. The Energy Data and Modelling Centre, Institute of Energy Economics, Japan. [NPR, MoS]
IIASA, 1998: Energy in a finite world, paths to a sustainable future. International Institute for Applied Systems Analysis, Vienna, Ballinger Publishing Company, ISBN 0-88410-641-1, 225 pp. [NPR, MoS]
IIASA/WEC, 1998: Global Energy Perspectives. N. Nakicenovic, A. Grübler, and A. McDonald, (eds.), International Institute for Applied Systems Analysis, Vienna, and World Energy Council, Cambridge University Press, 1998. [NPR]
IHA, 2006: Sustainability assessment protocol. International Hydropower Association, < www.hydropower.org > accessed 02/07/07. [NPR]
IMF, 2001: International Monetary Fund, the Democratic Republic of Congo. 2001 article iv consultation and discussions on staff-monitored program, Country Report No. 01/114, Washington D.C. [NPR]
IPCC, 1997: Revised 1996 IPCC guidelines for national greenhouse gas inventories. Intergovernmental Panel on Climate Change (IPCC), Volume 3. [NPR]
IPCC, 2001: Climate Change 2001: Mitigation - Contribution of Working Group III to the Third Assessment Report of the Intergovernmental Panel on Climate Change (IPCC) [Metz, B., O. Davidson, R. Swart, and J. Pan (eds.)]. Cambridge University Press, Cambridge, 700 pp. [NPR]
IPCC, 2005: IPCC special report on Carbon dioxide Capture and Storage. Prepared by Working Group III of the Intergovernmental Panel on Climate Change [Metz, B., O. Davidson, H.C. de Coninck, M. Loos and L.A. Meyer (eds.)], Cambridge University Press, Cambridge, United kingdom and New York, NY, USa, 442 pp. [NPR]
IPCC, 2006: IPCC Guidelines for national greenhouse gas inventories. Report of the Intergovernmental Panel on Climate Change, Cambridge University Press, Cambridge. < http://www.ipcc-nggip.iges.or.jp/public/2006gl/index.htm > accessed 02/07/07. [NPR]
IRIN, 2004: Angola: frustration as oil windfall spending neglects the poor. United Nations Integrated Regional Information Networks, < http://www.irinnews.org/report.asp?ReportID=43013 & SelectRegion=Southern_Africa > accessed 02/07/07. [NPR]
ISES, 2005: Proceedings on International Solar Energy Society (ISES). 2005 Solar World Congress, D.Y. Goswami, S. Vijayaraghaven, and R. Campbell-Howe R (eds.), Orlando, Florida, August. [NPR]
ISNA, 2004: From wood to coal in an effort to stop deforestation. Inter Services news agency (IPS), Rome, < http://www.ipsnews.net/interna.asp?idnews=25947 > accessed 02/07/07. [NPR]
ITDG, 2003: Sustainable energy for poverty reduction: an action plan. ISES, 2005: Proceedings of the International Solar Energy Society (ISES), 2005 Solar World Congress, D. Goswami, D.Y. Vijayaraghaven, and R. Campbell-Howe (eds.), Orlando, Florida, August. [NPR]
ITER, 2006: International Thermonuclear Experimental Reactor (ITER). < http://www.iter.org/ > accessed 02/07/07. [NPR]
Jack, D., 2004: Income, household energy and health. Kennedy School of Government, Harvard MA, 16 pp. [NPR]
JAEC, 2005: Framework for nuclear energy policy. Japan Atomic Energy Commission < http://www.aec.go.jp/jicst/NC/tyoki/tyoki_e.htm > accessed 02/07/07. [NPR]
Jaffe, A.B., R.G. Newell, and R.N. Stavins, 2005: A tale of two market failures - technology and environmental policy. Ecological Economics, 54, pp. 164-174. Clean
Jäger-Waldau, A., 2003: PV status report 2003 - research, solar cell production and market implementation in Japan, USA and European Union. Joint Research Centre, European Commission. [NPR]
Janssen, R., 2002: Renewable energy into the mainstream. International Energy Agency, Publication Service, OECD, Paris, France, 54 pp. [NPR]
Jimison, J., 2004: The advantages of combined heat and power. Workshop on Distributed Generation and Combined Heat and Power, April, EPRI (Electric Power Research Institute), Palo Alto, California. [NPR]
Jochem, E. and R. Madlener: 2002: The forgotten benefits of climate change mitigation: innovation, technological leapfrogging, employment and sustainable development. OECD Workshop on the Benefits of Climate policy: Improving Information for Policy Makers, 12-13 December, Paris, France. [NPR, ARC]
Johansson, T.B., 2004: The potentials of renewable energy: thematic background paper, Renewables, 2004. International Conference for Renewable Energies, Bonn, http://www.renewables2004.de/pdf/tbp/TBP10-potentials.pdf > accessed 02/07/07. [NPR]
Johansson, T.B. and W. Turkenburg, 2004: Policies for renewable energy in the European Union and its member states - an overview. Energy for Sustainable Development, VIII(1), pp. 5-24. Clean
Johansson, T.B., K. McCormick, L. Neij, and W. Turkenburg, 2004: The potentials of renewable energy, Thematic background paper for International conference “Renewables2004”, Bonn, June, <www.renewables2004.de> accessed 02/07/07. [NPR]
Jönsson, 2004: [website] < http://www.novaenergie.ch/iea-bioenergy-task37/Dokumente/06%20biogasupgrading.pdf > accessed 02/07/07. [NPR]
Kamman, D.M., K. Kapadia, and M. Fripp, 2004: Putting renewables to work: how many jobs can the clean energy industry generate? Renewable and Appropriate Energy Laboratory (RAEL) report, University of California, Berkeley, 24 pp. [NPR]
Kantei, 2006: < http://www.kantei.go.jp/foreign/policy/kyoto/050428plan_e.pdf > accessed 02/07/07. [NPR]
Karekezi, S. and W. Kithyoma, 2003: Renewable and rural energy overview in sub-Saharan Africa. African Energy Policy Research Network (AFREPREN)/FWD Secretariat, Nairobi, Kenya. [NPR]
Karl, T.L. and I. Gary, 2004: The global record. Petropolitics special report, January 2004: Foreign Policy in Focus (FPIF), Silver City, New Mexico and Washington D.C., 8 pp. [NPR]
Kessels, J.R. and S.J.A. Bakker, 2005: ESCAPE: energy security & climate policy evaluation. ECN-C--05-032, ECN, Petten, Netherlands, < http://www.ecn.nl/library/reports/2005/c05032.html > accessed 02/07/07. [NPR]
Kessides, I.N., 2004: Reforming infrastructure privatisation regulation and competition. World Bank policy research report, a co-publication of World Bank and Oxford University Press, Oxford, UK. [NPR]
Kirjavainen, M., T. Savola, and M. Salomon, 2004: Small scale biomass CHP technologies: situation in Finland, Sweden and Denmark. OPET report 12, contract to European Commission, Directorate General for Energy and Transport, < http://www.opet-chp.net/download/wp2/small_scale_biomass_chp_technologies.pdf > accessed 02/07/07. [NPR]
Komiyama, R., Z. Li and K. Ito, 2005: World energy outlook in 2020 focusing on China’s energy impacts on the world and Northeast Asia. International Journal on Global Energy Issues, 24(3/4), pp. 183-210. Clean
Koster, A., H.D. Matzner, and D.R. Nichols, 2003: PBMR design for the future. Nuclear Engineering and Design, 222(2-3) pp. 231-245, June. [MoS]
Krogsgaard, O.T., 2001: Energiepolitiken som vinden blaeser, (Energy policy as the wind blows). Politiken, 14 January. [NPR]
Lang, Q., R.S. Chapman, D.M. Schreinemachers, L. Tian and X. He, 2002: Household stove improvement and risk of lung cancer in Xuanwei China. Journal of the National Cancer Institute, 94(11), pp. 826-834. Clean
Larson, E.D. and H. Yang, 2004: DME from coal as a household cooking fuel in China. Energy for Sustainable Development, 8(3), pp. 115-126. [ARC]
Larson, E.D., Z.X. Wu, P. Delaquil, W.Y. Chen, and P.F. Gao, 2003: Future implications of China-technology choices. Energy Policy, 31(12), pp. 1189-1204. [MoS, ARC]
Lauber, V., 2004: REFIT and RPS: options for a harmonized community framework. Energy Policy, 32(12), pp. 1405-1414. Clean
Leite, C. and J. Weidmann, 1999: Does mother nature corrupt? Natural resources, corruption and economic growth. IMF working paper WP/99/85, International Monetary Fund, Washington D.C. [NPR]
Linden, N.H., M.A. Uyterlinde, C. Vrolijk, L.J. Nilsson, J. Khan, K. Astrand, K. Ericsson, and R. Wiser, 2005: Review of international experience with renewable energy obligation support mechanisms. ECN, Petten, Netherlands, May 2005. [NPR]
London Health Commission, 2003: Energy and health: making the link. City Hall, London. [NPR]
Lort-Phillips, E. and V. Herrigshaw, 2006: Beyond the rhetoric, measuring transparency in the oil and gas industry. In Global Corruption Report 2006: Transparency International, Pluto Press, London. [NPR]
Lovei, L. and A. McKechnie, 2000: The costs of corruption for the poor - the energy sector, public policy for the private sector. Note no. 207, The World Bank, Washington D.C. [NPR]
Luther, J., 2004: Research and development - the basis for wide-spread employment of renewable energies. International Conference for Renewable Energies, thematic background paper, Bonn, June, < www.renewables2004.de > accessed 02/07/07. [NPR]
Maeda, H., 2005: The global nuclear fuel market - supply and demand 2005-2030. WNA Market Report, World Nuclear Association Annual Symposium 2005, < http://world-nuclear.org/sym/2005/maeda.htm > accessed 02/07/07. [NPR]
Mago, R., 2004: Nuclear power - an option to meet the long term electricity needs of the country. Nuclear Power Corporation of India Ltd, Mumbai, India. [NPR]
Margolis, R.M. and D.M. Kammen, 1999: Underinvestment: the energy technology and R&D policy challenge. Science, 285, pp. 690-692. [JoC]
Martinot, E. (lead author) et al., 2005: Renewables 2005: Global status report. REN21 Renewable Energy Policy Network, <http://www.ren21.net/globalstatusreport/g2005.asp> accessed 02/07/07. [NPR, SRC]
Martinot, E. et al., 2006: Renewables 2006 global status report. REN21 Renewable Energy Policy Network, www.ren21.net/globalstatusreport/issuesGroup.asp accessed 02/07/07. [NPR, SRC]
Maycock, P., 2003: PV market update. Journal Renewable Energy World, 6(4), July/August 2003, pp. 84-101. Clean
Mazza, P. and R. Hammerschlag, 2003: Carrying the energy future: comparing hydrogen and electricity for transmission, storage and transportation. Institute for Lifecycle Environmental Assessment, Seattle, Washington, 98122-0437, < www.ilea.org > accessed 02/07/07. [NPR, MoS]
McDonald, A. and D. Schrattenholzer, 2001: Learning rates for energy technologies. Journal of Energy Policy, 29, pp. 255-261. Clean
MCH/WLPGA, 2005: Statistical Review of global LP gas. MCH Oil & Gas Consultancy/World LP Gas Association. [NPR]
Menanteau, P., F.D. Land, and M-L. Lamy, 2001: Prices versus quantities: Environmental policies for promoting the development of renewable energy. Institut d’Economie et de Politique de l’Energie (IEPE) report, May 2001: Grenoble, France, 23 pp. [NPR]
Menanteau, P., D. Finon, and M-L. Lamy, 2003: Prices versus quantities: choosing policies for promoting the development of renewable energy. Energy Policy, 31, pp. 799-812. Clean
METI, 2005: Japan’s Energy Outlook 2030. Ministry of Economy, Trade and Industry, Japan. [NPR]
MIT, 2003: The future of nuclear power. An interdisciplinary MIT study, Massachusetts Institute of Technology, E.J. Moniz and J. Deutch, Co-Chairs, < http://web.mit.edu/nuclearpower/ > accessed 02/07/07. [NPR, MoS]
Mishra, V., 2003: Indoor air pollution from biomass combustion and acute respiratory illness in preschool age children in Zimbabwe. International Journal of Epidemiology, 2003(32), pp. 847-853. Clean
Monirul, Q.M.M., 2004: Climate change and the Canadian energy sector: report on vulnerability impact and adaptation. Environment Canada. [NPR]
Moore, T., 2005: Coal based generation at the crossroads. EPRI Journal, Summer, Palo Alto, CA. [NPR]
Morthorst, P.E., 2004: Wind power - status and perspectives. In Future Technologies for a Sustainable Electricity System, Cambridge University Press, Cambridge. [NPR, MoS]
Nalbandian, H., 2002: Prospects for integrated pollution control in pulverised coal-fired power plant. International Energy Agency, Clean Coal Centre, London. [NPR]
NCOE, 2004: Ending the Energy Stalemate. National Commission on Energy Policy, Department of Energy, Washington D.C., 148 pp. [NPR]
NDA, 2006: Strategy. Nuclear Decommissioning Authority, April, <http://www.nda.gov.uk/documents/loader.cfm?url=/commonspot/security/getfile.cfm&pageid=4957> accessed 02/07/07. [NPR]
NEB, 2006: Oil sands - opportunities and challenges to 2015. Canadian National Energy Board < www.neb.gc.ca > accessed 02/07/07. [NPR]
NEI, 2006: Nuclear facts. Nuclear Energy Institute, < http://www.nei.org/doc.asp?catnum=2 & catid=106 > accessed 02/07/07. [NPR]
Nel, W., 2003: Feasibility of energy plant in Agulhas ocean current. Eskom Report No RES/SC/03/22509, Eskom Holdings Ltd., Johannesburg. [NPR]
NER, 2004: National integrated resource plan 2003/4: reference case. ISEP * Eskom (Resources and Strategy), Energy Research Institute, University of Cape Town and the National Electricity Regulator, Pretoria, <www.ner.org.za> accessed 02/07/07. [NPR]
NERI, 2004: Investigations of migratory birds during operation of Horns Rev offshore wind farm. National Environmental Research Institute, Ministry of the Environment, Denmark. [NPR]
Netalieva, I., J. Wesseler, and W. Heijman, 2005: Health costs caused by oil extraction air emissions and the benefits from abatement: the case of Kazakhstan. Energy Policy, 33, pp. 1169-1177. Clean
Neuhoff, K., 2004: Large scale deployment of renewables for electricity generation. Publication Service, OECD, Paris, France, 40 pp. [NPR]
Newman, J., N. Beg, J. Corfee-Morlot, G. McGlynn, and J. Ellis, 2002: Climate change and energy: trends, drivers, outlook and policy options. OECD Publication Service, Paris, France, 102 pp. [NPR]
NREL, 2005: Renewable Energy Cost Trends. Golden Colorado, < www.nrel.gov/analysis/docs/cost curves 2005.ppt > accessed 02/07/07. [NPR]
Nuclear News, 2005: WNA report forecasts three scenarios for nuclear’s growth. Nuclear News, November 2005: pp. 60-62, 69. [MoS]
OECD, 2000: The radiological impacts of spent nuclear fuel management options. Comparative study, OECD, Paris, < http://www.nea.fr/html/rp/reports/2000/nea2328-PARCOM-ENG.pdf > accessed 02/07/07. [NPR]
OECD, 2001: Trend in the nuclear fuel cycle, economic, environmental and social aspects. OECD, Paris. < http://www1.oecd.org/publications/e-book/6602011e.pdf > accessed 02/07/07. [NPR]
OECD, 2002a: Dealing with climate change - policies and measure in IEA member countries, Organisation for Economic Cooperation and Development Publication Service, OECD, Paris, France, 151 pp. [NPR]
OECD, 2002b: Reforming energy subsidies. UN Environmental Programme and Organisation for Economic Cooperation and Development, OECD/IEA, Oxford, UK, 31 pp. [NPR]
OECD, 2003: Decommissioning nuclear power plants: policies, strategies and costs. OECD Nuclear Energy Agency, 105 pp. ISBN 92-64-10431-3. < http://www1.oecd.org/publications/e-book/6603221E.pdf > accessed 02/07/07. [NPR]
OECD, 2004a: Uranium 2003: resources, production and demand. Joint Report by the OECD Nuclear Energy Agency and the International Atomic Energy Agency, OECD, Paris. [NPR]
OECD, 2004b: Biomass and Agriculture - sustainability markets and policies. Organisation of Economic and Co-operative Development, Paris, ISBN 92-64-10555-7. [NPR]
OECD, 2006a: Global science forum on scientific challenges for energy research. Paris, May, < www.oecd.org/sti/gsf/energy > accessed 02/07/07. [NPR]
OECD, 2006b: Uranium 2005: resources, production and demand. Joint Report by the OECD Nuclear Energy Agency and the International Atomic Energy Agency, OECD/NEA, ISBN: 92-64-02425-5388 pp. [NPR]
OECD, 2006c: Advanced nuclear fuel cycles and radioactive waste management. ISBN: 92-64-02485-9, OECD/NEA, 248 pp. [NPR]
OECD/IEA, 2005: Legal aspects of storing CO2. Joint International Energy Agency / Carbon Sequestration Leadership Forum workshop, Paris, July 2004. [NPR]
OFGEM, 2005: Renewables Obligation - an overview of the second year. Office for Gas and Electricity Markets, http://www.ofgem.gov.uk/Media/FactSheets/Documents1/9693-renewablesfsupdatefeb05.pdf > accessed 02/07/07. [NPR]
Olsen, K.H. and J. Fenhann, 2006: Sustainable development benefits of clean development projects. CD4CDM Working Paper Series, Working Paper No. 2, Risoe, October 2006 [NPR, SRC]
Outhred, H. and I. MacGill, 2006: Integrating wind energy in the Australian National Electricity market. Proceedings of the World Renewable Energy Congress IX, August, ISBN 008 44671 X. [NPR]
Oxera, 2005: What is the impact of limiting ROC eligibility for low-cost renewable generation technologies? Final report to the Department of Trade and Industry, London, 44 pp. Oxera Consulting Ltd, Oxford. [NPR]
Patrinos, A., 2006: The promises of biotechnology. Synthetic Genomics Inc, USA, paper, OECD conference Scientific Challenges for Energy Research, Paris, 17-18 May. [NPR]
Philibert, C., 2004: Case study 1: concentrating solar power technologies. International Energy Technology Collaboration and Climate Change Mitigation, OECD Environmental Directorate, IEA, Paris. [NPR]
Philibert, C. and J. Podkanski, 2005: International energy technology collaboration and climate change mitigation case study 4: clean coal technologies. International Energy Agency, Paris. [NPR]
Philibert, C., 2006: Barriers to the diffusion of solar thermal technologies. OECD and IEA Information Paper, International Energy Agency, Paris. [NPR]
Plouchart, G., A. Fradet, and A.Prieur, 2006: The potential of CO2 Capture and Storage of worldwide electricity related greenhouse gases emissions in oil and gas fields. Paper at the 8th Greenhouse gas technologies conference, June 19 - 22, 2006: Trondheim, Norway. [NPR]
Price, L. and S. de la Rue du Can, 2006: Sectoral trends in global energy use and greenhouse gas emissions. Lawrence Berkeley National Laboratory, LBNL-56144. [NPR, ARC]
Ragwitz, M., J. Schleich, C. Huber, G. Resch, T. Faber, M. Voogt, R. Coenraads, H. Cleijne, and P. Bodo,.2005: Analyses of the EU renewable energy sources’ evolution up to 2020 (FORRES 2020, Fraunhofer Institute, Karlsruhe, Germany.. [NPR]
Read, P. and J.R. Lermit, 2005: Bioenergy with carbon storage(BECS): a sequential decision approach to the threat of abrupt climate change. Energy, 30(14), pp. 2654-2671. [ARC]
Renewables, 2004: International Conference for Renewable Energies. Proceedings, Conference Report, Outcomes and Documentation, Political Declaration/International Action Programme/Policy Recommendations for Renewable Energy, 1-4 June 2004, Bonn, Germany, 54 pp., < www.renewables2004.de > accessed 02/07/07. [NPR]
Ristau, O., 2003: Sunny prospects on the Costa del Sol. Journal New Energy, 3(2003), pp. 48-50. Clean
Roques, F.A., W. J. Nuttall, D.M. Newbery, R. de Neufville, and S. Connors, 2006: Nuclear power: a hedge against uncertain gas and carbon prices? The Energy Journal, 27(4), pp. 1-23. Clean
Rogner, H.H., 2003: Nuclear power and climate change. World Climate Change Conference (WCCC), Moscow (20 September-3 October), < http://www.world-nuclear.org/wgs/cop9/cop-9_holger.pdf > accessed 02/07/07. [NPR, ARC]
Royal Academy of Engineering, 2004: The cost of generating electricity. ISBN 1-903496-11-X, London, < http://www.nowap.co.uk/docs/generation_costs_report.pdf > accessed 02/07/07. [NPR]
Sagie, D., 2005: Feasibility study of 100MWe solar power plant. Proceedings of the International Solar Energy Society (ISES), 2005 Solar World Congress, D.Y. Goswami, S. Vijayaraghaven, and R. Campbell-Howe (eds.), Orlando, Florida, August. [NPR]
Saunders, A. and K. Schneider, 2000: Removing energy subsidies in developing and transition economies, energy markets and the new millennium: Economic Environment, Security of Supply. 23rd Annual IAEE International Conference, Sydney, Australia, 21 pp. [NPR]
Sawin, J.L, 2003a: National policy instruments: policy lessons for the advancement & diffusion of renewable energy technologies around the world. Thematic background paper, pp. 56, International Conference for Renewable Energies, 1-4 June 2004: Bonn, Germany, <www.renewables2004.de> accessed 02/07/07. [NPR]
Sawin, J.L., 2003b: Charting a new energy future, in State of the World 2003. L. Starke, W.W. Norton and Company (eds.), New York, pp 85-109. [NPR, MoS]
Schlamadinger, B., R. Edwards, K.A. Byrne, A. Cowie, A. Faaij, C. Green, S. Fijan-Parlov, L. Gustavsson, T. Hatton, N. Heding, K. Kwant, K. Pingoud, M. Ringer, K. Robertson, B. Solberg, S. Soimakallio, and S. Woess-Gallasch, 2006: Optimizing the greenhouse gas benefits of bioenergy systems. Proceedings of the 14th European Biomass Conference, 17-21 October 2005: Paris, France, pp. 2029-2032. [NPR, SRC]
Sekar, R.S., 2005: Carbon dioxide capture from coal-fired power plants: a real options analysis. MSc Thesis, MIT. < http://sequestration.mit.edu/pdf/LFEE_2005-002_RP.pdf > accessed 02/07/07. [NPR]
Shell, 2006: Sustainable choices, stakeholder voices: 2005. Sustainable Development Report, pp. 36. [NPR]
Shorrock, T., 2002: Enron’s Asia misadventure. Asia Times 29 January, < http://www.atimes.com/global-econ/DA29Dj01.html > accessed 02/07/07. [NPR]
Sikar, E., 2005: Greenhouse gases and initial findings on the carbon circulation in two reservoirs and their watersheds. Verhandlung Internationale Vereinigung für Limnologie, 27. [NPR]
Sims, R.E.H., 2002: The Brilliance of Bioenergy - the business and the practice. James & James, (Science Publishers) London, 316 pp. ISBN 1-902916-28-X. [NPR, SRC]
Sims, R.E.H., 2003: Renewable energy - a response to climate change. Proceedings of the International Solar Energy Society World Congress 2001: Adelaide, W.Y. Saman and W.W.S. Charters (eds.), Australian and New Zealand Solar Energy Society, 1, pp. 69-79. [SRC]
Sims, R.E.H., H-H. Rogner, and K. Gregory, 2003a: Carbon emission and mitigation cost comparisons between fossil fuel, nuclear and renewable energy resources for electricity generation. Energy Policy, 31, pp. 1315-1326. [SRC]
Sims, R.E.H., N. El Bassam, R.P. Overend, K.O. Lim, K. Lwin and P. Chaturvedi, 2003b: Bioenergy options for a cleaner environment - in developed and developing countries. Elsevier, Oxford, 184 pp., ISBN 0 08 0443516. [NPR, SRC]
Sims, R.E.H., 2004: Biomass, Bioenergy and Biomaterials - future prospects, ‘Biomass and Agriculture - sustainability markets and policies’. Pp. 37-61 ISBN 92-64-10555-7. OECD, Paris. [NPR, MoS, SRC]
Singh, V. and J. Fehrs, 2001: The work that goes into renewable energy. Research Report, Renewable Energy Policy Project (REPP), November 2001: No.13, 28, Washington D.C. [NPR]
Sloss, L., C. Henderson, and J. Topper, 2003: Environmental standards and controls and their influence on development of clean coal technologies. International Energy Agency Clean Coal Centre, London. [NPR]
Smith, K.R., 2002: Indoor air pollution in developing countries: recommendations for research. Indoor Air, 12, pp. 198-207. Clean
Smith, K.R., J. Zhang, R. Uma, W.N. Kishore, V. Joshi, and M.A.K. Khalil, 2000a: Greenhouse implications of household fuels: an analysis for India. Annual Review of Energy and Environment 25, pp. 741-763. Clean
Smith, K.R., J.M. Samet, I. Romieu, and N. Bruce, 2000b: Indoor air pollution in developing countries and acute lower respiratory infections in children. Thorax, 55, pp. 518-532. Clean
Smith, S., A. Brenket, and J. Edmonds, 2006b: Biomass with carbon dioxide capture and storage in a carbon-constrained world. GHGT8 proceedings, Trondheim, Norway. [NPR, ARC]
Snow, T., White House Press Briefing, 2006: < http://www.whitehouse.gov/news/releases/2006/10/20061031-8.html > , < http://www.whitehouse.gov/news/releases/2006/10/20061031-8.html# > accessed 31 October 2006. [NPR]
Spadaro K, 2000: Greenhouse gas emissions of electricity generation chains - Assessing the difference. International Atomic Energy Agency (IAEA) Bulletin 42/2/2000. [NPR]
Specker, S., 2006: Generation technologies in a carbon-constrained world. Electric Power Research Institute, Palo Alto, California, March. [NPR]
Stern, N., 2006: The economics of climate change. <http://www.hm-treasury.gov.uk/independent_reviews/stern_review_economics_climate_change/sternreview_index.cfm> accessed 02/07/07. [NPR]
Stirling, 2005: Concentrated solar power development company. < http://www.stirlingenergy.com/news.asp?Type=stirling > accessed 02/07/07. [NPR]
Storm van Leeuwen, J.W. and P. Smith, 2005: Nuclear power: the energy balance, < http://www.stormsmith.nl/ > accessed 02/07/07. [NPR, ARC]
Swart, R., J. Robinson, and S. Cohen, 2003: Climate change and sustainable development: expanding the options. Climate Policy, 3S1, pp. 19-40. [JoC, ARC]
Testor, J.W., E.M. Drake, M.W. Golay, M.J. Driscoll, and W.A. Peters, 2005: Sustainable energy - choosing among options. MIT Press, Cambridge, Massachusetts. [NPR, SRC]
Tremblay, A. (ed.), 2005: Greenhouse gas emissions - fluxes and processes. Hydroelectric Reservoirs and Natural Environments. Springer, Berlin. [NPR]
Trieb, F., 2005: Concentrating solar power for the Mediterranean region (MED-CSP). Study prepared for the German Federal Ministry for the Environment, Nature Conservation and Nuclear Safety (BMU), March, < http://www.dlr.de/tt/ > accessed 02/07/07. [NPR]
Uchiyama, Y., 1996: Life cycle analysis of electricity generation and supply systems, Electricity, Health and the Environment: Comparative Assessment in Support of Decision Making. IAEA, Vienna. [NPR, SRC]
Uchiyama, Y. and H. Yamamoto, 1995: Life cycle analysis of power generation plants, CRIEPI report Y94009. [NPR, SRC]
UCS, 2005: Renewable electricity standards at work in the States. < http://www.ucsusa.org/clean_energy/clean_energy_policies/res-at-work-in-the-states.html > accessed 02/07/07. [NPR]
UKERC, 2006: The costs and impacts of intermittency. UK Energy Research Centre, Imperial College, London, ISBN 1 90314 404 3, < www.ukerc.ac.uk/content/view/259/953 > accessed 02/07/07. [NPR]
UN, 2000: General Assembly of the United Nations Millennium Declaration. 8th Plenary meeting, September, New York. [NPR]
UN, 2004: Integration of the economies in transition into the world economy. A report on the activities of the Economic Commission for Europe, Department Policy and Planning Office, < http://www.un.org/esa/policy/reports/e_i_t/ece.pdf > accessed 02/07/07. [NPR]
UNDESA, 2002: The Johannesburg plan of implementation. United Nations Department of Economic and Social Affairs, New York. [NPR]
UNDP, 2000: Energy and the challenge of sustainability. World Energy Assessment, United Nations Development Programme, UNDESA and World Energy Council, ISBN 9211261260, New York, <http://www.undp.org/energy/activities/wea/drafts-frame.html> accessed 02/07/07. [NPR]
UNDP, 2004a: World energy assessment, overview 2004: an update of ‘Energy and the challenge of sustainability, world energy assessment’. Published in 2000: UNDESA/WEC, United Nations Development Program, New York. [NPR]
UNDP, 2004b: Access to modern energy services can have a decisive impact on reducing poverty. http://www2.undp.org.yu/files/news/20041119_energy_poverty.pdf > accessed 02/07/07. [NPR]
UNEP, 2004: Energy technology fact sheet, Cogeneration. UNEP Division of Technology, Industry and Economics - Energy and Ozone Action Unit, < http://www.cogen.org/Downloadables/Publications/Fact_Sheet_CHP.pdf > accessed 02/07/07. [NPR]
UNEP, 2006: The UNEP Risoe CDM/JI pipeline. October, < www.cd4cdm.org/Publications/CDMPipeline.xls > accessed 02/07/07. [NPR]
UNESCO, 2006: Workshop on GHG from freshwater reservoirs. 5-6 December, United Nations Educational, Scientific and Cultural Organization Headquarters, Paris, France, UNESCO IHP-VI website, < www.unesco.org/water/ihp/ > accessed 02/07/07. [NPR]
University of Chicago, 2004: The economic future of nuclear power. < http://www.anl.gov/Special_Reports/NuclEconAug04.pdf > accessed 02/07/07. [NPR, MoS]
UIC, 2005: Civil liability for nuclear damage. Uranium Information Centre, Nuclear Issues Briefing Paper # 70, December, < http://www.uic.com.au/nip70.htm > accessed 02/07/07. [NPR]
UNFCCC, 2004: Synthesis and assessment report of the greenhouse gas inventories submitted in 2004 from Annex-I countries. Pp. 66, 75, 93, and 94. [NPR]
UNFCCC, 2006: Definition of renewable biomass. Minutes of CDM EB23, Annex 18, < http://cdm.unfccc.int/EB/Meetings/023/eb23_repan18.pdf > accessed 02/07/07. [NPR]
USCCTP, 2005: United States Climate Change Technology Program, < http://www.climatetechnology.gov/library/2003/tech-options/ > accessed 02/07/07. [NPR]
US DOE, 2004: FutureGen-integrated hydrogen. Electric Power Production and Carbon Sequestration Research Initiative, < http://www.fossil.energy.gov/programs/powersystems/futuregen > accessed 02/07/07. [NPR, MoS]
US DOE, 2005: Projected benefits of federal energy efficiency and renewable energy programs (FY2006- FY2050), Long-term benefits analysis of EERE’s Programs (Chapter 5). Department of Energy, Washington D.C. [NPR]
US DOE, 2006: Global nuclear energy partnership (GNEP). < http://www.gnep.energy.gov/ > accessed 02/07/07. [NPR]
US EIA, 2004: Long term world oil supply. Washington D.C. <http://www.eia.doe.gov/pub/oil_gas/petroleum/presentations/2004/worldoilsupply/oilsupply04> gevonden <http://tonto.eia.doe.gov/FTPROOT/features/longterm.pdf> accessed 02/07/07. [NPR]
US EIA, 2005: International energy outlook 2005. U.S. Energy Information Administration, Office of Integrated Analysis and Forecasting, U.S. Department of Energy, Washington, D.C., 186 pp, < http://www.eia.doe.gov/oiaf/ieo/index.html > accessed 03/07/07. [NPR, MoS]
US EPA, 2003: Assessment of the worldwide market potential for oxidizing coal mine ventilation air methane. United States Environmental Protection Agency, Washington D.C., July. [NPR]
USGS, 2000: United States Geological Survey, World Assessment Summary. [NPR]
USGS, 2004a: United States Geological Survey fact sheet, December 2. < http://marine.usgs.gov/fact-sheets/gas-hydrates/title.html > accessed 03/07/07. [NPR]
USGS, 2004b: United States Geological Survey fact sheet, December 1. < http://energy.usgs.gov/factsheets/Coalbed/coalmeth.html > accessed 03/07/07. [NPR]
US NAE 2004, The Hydrogen Economy: Opportunities, Costs, Barriers and R&D Needs, U.S. National Academy of Engineering, Washington, D.C., 2004. [NPR]
Vallette, J. and D. Wysham, 2002: Enron’s pawns - how public institutions bankrolled Enron’s globalization game. Sustainable Energy and Economy Network, Institute of Policy Studies, Washington D.C. [NPR]
Vate, J.F. van de, 2002: Full-energy-chain greenhouse-gas emissions: a comparison between nuclear power, hydropower, solar power and wind power. International Journal of Risk Assessment and Management 2002, 3(1), pp. 59-74. [NPR]
Vattenfall, 2005: Certified environmental product declaration of electricity from Forsmark NPP (updated 2005) and Ringhals NPP. S-P-00021& S-P-00026, June 2004. < http://www.environdec.com/reg/021/Chapters/Dokument/EPD-FKA-2005.pdf > , < http://www.environdec.com/reg/026/Chapters/Dokument/EPD-Ringhals.pdf > accessed 03/07/07. [NPR]
Venkataraman, C., G. Habib, A. Eiguren-Fernandez, A.H. Miguel, and S.K. Friedlander, 2004: Residential biofuels in South Asia: carbonaceous aerosol emissions and climate impacts, Science, 307(5714), pp.1454-1456. [JoC]
Venn, J., 2005: Rapid access to modern energy services using LP gas. Energy & Environment, 16(5), Multi-Science Publishing Co. Ltd., Brentwood. Clean
Verweij, M., 2003: Leaking pipelines - Shell in South Africa. The Globalization and Energy Project, Milieudefensie, Amsterdam, Netherlands, 17 pp. [NPR]
WADE, 2005: World survey of decentralized energy 2005. Edinburgh, UK, [NPR]
WADE, 2006: World survey of decentralized energy 2006. < www.localpower.org > accessed 03/07/07. [NPR]
Wamukonya, N., 2003: Power sector reform in developing countries: mismatched agendas. In Electricity Reform: Social and Environmental Challenges, N. Wamukonya (ed.), United Nations Environmental Programme, Roskilde, pp. 7-47. [NPR, SRC]
Wavegen, 2004: < www.wavegen.com > accessed 03/07/07. [NPR]
WBCSD, 2004: Energy and climate change - facts and trends to 2050. World Business Council for Sustainable Development, Geneva, Switzerland, < www.wbcsd.org > accessed 03/07/07. [NPR]
WCD, 2000: Dams and development - a new framework for decision making. World Commission on Dams, < www.dams.org > accessed 03/07/07. [NPR]
WEC, 2001: Performance of generating plant, World Energy Council, London. [NPR]
WEC, 2004a: Comparison of energy systems using life cycle assessment - special report. World Energy Council, July, London. [NPR]
WEC, 2004b: Oil and gas exploration & production: reserves, costs, contracts. Technip, 102 pp. [NPR]
WEC, 2004c: 2004 Survey of energy resources. World Energy Council, London. [NPR]
WEC, 2004d: Energy end-use technologies for the 21st Century. World Energy Council, London, UK, 128 pp., < www.worldenergy.org/wec-geis > accessed 03/07/07. [NPR]
Weiss, W., I. Bergmann, and G. Faninger, 2005: Solar heating worldwide: markets and contribution to energy supply. Solar Heating and Cooling Programme, International Energy Agency, Paris, < www.iea-shc.org > accessed 03/07/07. [NPR]
West, J.J., P. Osnaya, I. Laguna, J. Martínez, and A. Fernández, 2004: Co-control of urban air pollutants and greenhouse gases in Mexico City. Environmental Science and Technology, 38(13), pp. 3474 -3481. Clean
Whispergen, 2005: Small Stirling engine combined heat and power plants. Whispertech Company Ltd., Christchurch, New Zealand, < www.whispertech.co.nz > accessed 03/07/07. [NPR]
WHO, 2002: The world health report 2002 - reducing risks, promoting healthy life. World Health Organisation, Geneva, Switzerland, 248 pp. [NPR]
WHO, 2003: Exposure assessment in studies on the chronic effects of long-term exposure to air pollution. World Health Organisation report on a WHO/HEI Workshop, Bonn, Germany, 4-5 February 2002: Geneva, Switzerland. [NPR]
Williams, R.H., E.D. Larson, and H. Jin, 2006: Synthetic fuels in a world of high oil and carbon prices. Proceedings of the 8th International Conference on Greenhouse Gas Control Technologies, Trondheim, Norway, June. [NPR]
Wind Force 12, 2005: Global Wind Energy Council and Greenpeace, < http://www.gwec.net/index.php?id=8 > accessed 03/07/07. [NPR]
World Bank, 1998: Urban air quality management, pollution prevention and abatement handbook. Washington D.C. [NPR]
World Bank, 2004a: A voluntary standard for global gas flaring and venting reduction. The International Bank for Reconstruction and Development/The World Bank,Washington D.C. [NPR]
World Bank, 2004b: Striking a better balance - the World Bank group and extractive industries: the final report of the extractive industries review. Washington D.C., 52 pp. [NPR]
World Bank, 2005: An open letter to the Catholic Relief Services and bank information centre in response to the report ‘Chad’s Oil: Miracle or Mirage for the poor?’. News release no: 2005/366/AFR, Washington D.C. [NPR]
World Bank, 2006: Clean energy and development: towards an investment framework. Environmental and Socially Sustainable Development Vice Presidency, World Bank, Washington D.C., March. [NPR]
WNA, 2003: Global warming. Issue Brief, January 2003, World Nuclear Association, < www.world-nuclear.org/info/inf59.htm > accessed 03/07/07. [NPR]
WNA, 2005a: The global nuclear fuel market: supply and demand 2005-2030. World Nuclear Association report, < www.world-nuclear.org/info/ > accessed 03/07/07. [NPR]
WNA, 2005b: The new economics of nuclear power. World Nuclear Association report, < http://www.world-nuclear.org/reference/pdf/economics.pdf > accessed 03/07/07. [NPR]
WNA, 2006a: World nuclear power reactors 2005-06 and uranium requirements. World Nuclear Association, May 2006, < http://www.world-nuclear.org/info/reactors.htm > accessed 03/07/07. [NPR]
WNA, 2006b: Nuclear power in China. Issue Brief, World Nuclear Association, February 2006: < www.world-nuclear.org/info/inf63.htm > accessed 03/07/07. [NPR]
Woyllinowicz, D., C. Severson-Baker, and M. Raynolds, 2005: Oil sand fever. The Pembina Institute for Appropriate Development, Canada, < www.pembina.org > accessed 03/07/07. [NPR]
WREC, 2006: Proceedings of the 8th World Renewable Energy Congress, August, Firenze. [NPR]
WREA, 2005: Proceedings of World Renewable Energy Assembly, World Council of Renewable Energy, Bonn, November, < www.wrea2005.org > accessed 03/07/07. [NPR]
Yamashita, K. and L. Barreto, 2005: Energyplexes for the 21st Century. Energy, 30, pp. 2453- . Clean
Zhang, X.L., R. Chen, and J.K. He, 2005: Renewable energy development and utilisation in China: opportunities and challenges. International Journal on Global Energy Issues, 24(3/4), pp. 249-258. Clean
asp?type=faq & id=UltraCleanCoal & stylesheet=aboutCSIROInformationSheet > accessed 05/06/07.
Danish Energy Authority, 2005: Technology data for electricity and heat generation plants, < http://www.ens.dk/graphics/Publikationer/Forsyning_UK/Technology_Data_for_Electricity_and_Heat_Generating_Plants/index.htm > accessed 05/06/07. [NPR]
Datta, K.E., T. Feiler, K.R. Rábago, N.J. Swisher, A. Lehmann, and K. Wicker, 2002: Small is profitable. Rocky Mountain Institute, Snowmass, Colorado, ISBN 1-881071-07-3. < www.rmi.org > , accessed 05/06/07. [NPR]
de Moor, A., 2001: Towards a grand deal on subsidies and climate change. Journal Natural Resources Forum, 25(2), May. Clean
Dellero, N. and F. Chessé, 2006: New nuclear plant economics. IYNC 2006 conference paper 234, Stockholm, Sweden - Olkiluoto, Finland, 18-23 June, AREVA, World Nuclear Association, < http://www.world-nuclear.org/info/inf63.htm > accessed 05/06/07. [NPR]
Delmas, R., 2005: Long term greenhouse gas emissions from the hydroelectric reservoir of Petit Saut (French Guiana) and potential impacts. Global Warming and Hydroelectric Reservoirs, CDD 363.73874, pp. 117-124. [NPR]
DGEMP, 2003: Coûts de référence de la production électrique (Reference costs for power generation). Ministère de l’Economie des Finances et de l’Industrie, Direction générale de l’énergie et des matières premières (DGEMP), < http://www.industrie.gouv.fr/energie/electric/cdr-anglais.pdf > accessed 05/06/07. [NPR]
DME, 2003: White paper on renewable energy. Department of Minerals and Energy, Pretoria, South Africa. [NPR]
Dones, R, T. Heck, M. Faist Emmenegger, and N. Jungbluth, 2005: Life cycle inventories for the nuclear and natural gas energy systems, and examples of uncertainty analysis. International Journal LCA, 10(1), pp. 10-23. Clean
dos Santos, A.M, L.P. Rosaa, B. Sikard, E. Sikarb, and E.O. dos Santos, 2004: Gross greenhouse gas fluxes from hydro-power reservoirs compared to thermal power plants. aIVIG/COPPE/UFRJ and Energy Planning Program/COPPE/UFRJ, University of Grande Rio and University of Sao Paulo, Sao Carlos, Brazil. [NPR]
dos Santos, M.A. (ed.), 2005: Carbon budget in tropical reservoirs. Global Warming and Hydroelectric Reservoirs, CDD 363.73874, pp 95-100. [NPR]
Dooley, J J, R.T. Dahowski, C.L. Davidson, S. Bachu, N. Gupta and J. Gale, 2005: IEA greenhouse gas programme. Proceedings of 7th International Conference on Greenhouse Gas Control Technologies, Volume 1: Peer-Reviewed Papers and Plenary Presentations (E.S. Rubin, D.W. Keith and C.F. Gilboy, eds.), Cheltenham, UK, < http://www.ghgt7.ca > accessed 02/07/07 [NPR]
Dow Jones, 2006: Kratwerk mit pilotanlage fur CO2 abscheidung in Beitrib. Dow Jones Trade News Emissions, 19 May, 10, 11 pp. Clean
DTI, 1999: Coal liquefaction - technology status report. Department of Trade and Industry, London, UK. [NPR]
Dubash, N K, 2003: Revisiting electricity reform: the case for a sustainable development approach, Utilities Policy, 11, pp. 143-154 [NPR]
Duncan, A., 2005: Solar building developments. Master Applied Science thesis, Massey University Library, Palmerston North, New Zealand. [NPR]
EC, 2005: The support of electricity from renewable energy sources. European Commission COM(2005) 627 final, Brussels, 50 pp. [NPR]
EC, 2007: World energy technology outlook 2050 (WETO-H2) Report. Directorate-General for Research, European Commission, January, < http://ec.europa.eu/research/energy/gp/gp_pu/article_1100_en.htm > accessed 05/06/07. [NPR, 2007]
Edmonds, J. and S. Smith, 2006: The technology of two degrees, ‘Avoiding Dangerous Climate Change’. H.J. Schellenhuber, W. Cramer, N. Nakicenovic, T. Wrigley, and G. Yohe (eds), Cambridge University Press, pp. 385-391. [NPR, ARC]
EDUCOGEN, 2001: A guide to cogeneration, produced under the auspices of Contract N° XVII/4.1031/P/99-159. The European Association for the Promotion of Cogeneration, 51 pp. < www.cogen.org > accessed 05/06/07. [NPR]
EEA, 2004: Energy subsidies in the European Union - a brief overview. European Environment Agency, Technical report, Office for Official Publications of the European Communities, Luxembourg, 20 pp. [NPR]
EERE, 2005: A national vision of America’s transition to a hydrogen economy - to 2030 and beyond. < http:/www.eere.energy.gov/hydrogenandfuelcells/annual_report.html > accessed 05/06/07. [NPR]
EIA/DOE, 2005: Energy Information Administration, U.S. Department of Energy < www.eia.doe.gov/cabs/World_Oil_Transit_Chokepoints/Hormuz.html > and < www.eia.doe.gov/cabs/World_Oil_Transit_Chokepoints/Malacca.html > accessed 05/06/07. [NPR]
EIA/DOE, 2006: International Energy Outlook 2006. < www.eia.doe.gov/oiaf/ieo/index.html > accessed 05/06/07. [NPR]
Encyclopaedia of Energy, 2004: C.J. Cleveland, (ed.), Elsevier Academic Press, Oxford. 4, pp. 257-272. Clean
Enerdata, 2004: A global energy data base including OECD data. Grenoble, France. [NPR]
Energy Policy Act, 2005: http://energycommerce.house.gov/ accessed 05/06/07. [NPR]
Environment California, 2006: < www.environmentcalifornia.org/newsroom/energy/energy-program-news/million-solar-roofs-bill-sb-1-signed-into-law#1H202IC_O9f0derEDnExjw > accessed 05/06/07. [NPR]
EPA, 2003: SF6 emissions reduction partnership for electric power systems. 2002 Partnership Report, < http://www.epa.gov/highgwp/electricpower-sf6/pdf/2002-partnership-report.pdf > accessed 05/06/07. [NPR]
EPA, 2005a: Energy Star. Environmental Protection Agency, < http://www.energystar.gov/ > accessed 05/06/07. [NPR]
EPA, 2005b: Natural gas star program. Environmental Protection Agency, < http://www.epa.gov/gasstar/ > accessed 05/06/07. [NPR]
EPA, 2005c: Coalbed methane outreach program. Environmental Protection Agency, < http://www.epa.gov/cmop/ > accessed 05/06/07. [NPR]
EPRI, 2003: Electricity technology roadmap, 2003 summary and synthesis. Report No.1010929, Electric Power Research Institute, Palo Alto, California, USA. [NPR]
Equitech, 2005: Equitech International. LLC, < http://www.equitechllc.com/papers/carbonemissions.html > accessed 05/06/07. [NPR]
ERC, 2004: Solar electrification by the concession approach in the rural Eastern Cape; Phase 2 monitoring survey November 2003: < www.erc.uct.ac.za > accessed 05/06/07. [NPR]
ESMAP, 2004: Regulation of associated gas flaring and venting: a global overview and lessons from international experience. Energy Sector Management Assistance Programme (ESMAP) report 285/04, World Bank, Washington D.C. [NPR]
ESTIA, 2004: Exploiting the heat from the sun to combat climate change. European Solar Thermal Industry Association and Greenpeace, Solar Thermal Power 2020, UK. [NPR]
EU, 2001: Promotion of electricity from renewable energy sources in the internal electricity market. Directive 2001/77/EC of the European Parliament and of the Council, Official Journal of the European Communities, 27 October, pp. 33-40. Clean
EU, 2003: Directive 2003/30/EC of the European Parliament and of the Council on the promotion of the use of biofuels or other renewable fuels for transport. Official Journal of the European Communities, 17.5.2003: pp. 42-46. [NPR]
EU, 2005: Externalities of energy: extension of accounting framework and policy applications (ExternE-Pol). Final Report of project, < http://www.externe.info/expoltec.pdf > accessed 05/06/07. [NPR]
EUFORES, 2004: The impact of renewables on employment and economic growth. European Commission ALTENER program, < http://www.eufores.org/ > accessed 05/06/07. [NPR]
EWEA, 2004: Wind energy - the facts - an analysis of wind energy in the EU-25. European Wind Energy Association, Brussels. [NPR]
EWEA, 2005: Large scale integration of wind energy in the European power supply system: analysis, issues and recommendations. < http://www.ewea.org/fileadmin/ewea_documents/documents/publications/grid/051215_Grid_report_summary.pdf > accessed 05/06/07. [NPR]
EEA, 2005: Greenhouse gas emission trends and projections in Europe 2005: European Environment Agency. < http://reports.eea.eu.int > accessed 05/06/07. [NPR, MoS]
FACTS Inc., 2005: Gas data book: Asia-Pacific natural gas & LNG. Honolulu, Hawaii. [NPR]
Fearnside, P.M., 2004: Greenhouse gas emissions from hydroelectric dams: controversies provide a springboard for rethinking a supposedly clean energy source: Editorial Comment. Climatic Change, 66, pp. 1-2. [JoC]
Fisher, B, 2006: Industry related technology research. Proceedings of the Expert Review Meeting, Intergovernmetnal Panel on Climate Change (IPCC) WG III, Capetown, 17-19 January. [NPR, ARC]
Fouquet, D., C. Grots, J. Sawin, N. Vassilakos, 2005: Reflections on a possible unified EU financial support scheme for renewable energy systems (RES): a comparison of minimum-price and quota systems and an analysis of market conditions. Brussels and Washington D.C., January 2005, 26 pp. [NPR]
Friedman, 2003: Will innovation flourish in the future? The Industrial Physicist, January, pp. 22-25. [NPR]
Gary, I and T.L. Karl, 2003: Bottom of the barrel: Africa oil boom and the poor. Report Catholic Relief Services, Baltimore MD, 110 pp. [NPR]
Gehl, S, 2004: Generation technology choices: near and long term. US DOE/EPRI Annual Energy Outlook Conference, Washington D.C., www.eia.doe.gov/oiaf/archive/aeo04/conf/pdf/gehl.pdf [NPR, SRC]
accessed 05/06/07.
Gibbins, J., S. Haszeldine, S. Holloway, J. Pearce, J. Oakey, S. Shackley, and C. Turley, 2006: Scope for future CO2 emission reductions from electricity generation through the deployment of carbon capture and storage technologies. In Avoiding Dangerous Climate Change, H.J. Schellnhuber (ed.), Chapter 40, Cambridge University Press, ISBN: 13 978-0-521-86471-8 hardback, ISBN: 10 0-521-86471-2 paperback, 379 pp. < http://www.defra.gov.uk/environment/climatechange/research/dangerous-cc/index.htm > accessed 05/06/07. [NPR, MoS]
Giebel, G., 2005: Wind power prediction using ensembles. Risø National Laboratory, ISBN 87-550-3464-0, September, 43 pp. [NPR, MoS]
GIF, 2002: Technology roadmap for generation IV nuclear energy systems. US DOE Nuclear Energy Research Advisory Committee and the Generation IV International Forum (GIF), December. < http://gif.inel.gov/roadmap/pdfs/gen_iv_roadmap.pdf > accessed 05/06/07. [NPR]
GGFR, 2004: Global gas flaring reductions - a public/private partnership. Report number 6, September. [NPR]
Global Witness, 2004: Global policy forum (GPF), New York USA, < http://www.globalpolicy.org/ > accessed 05/06/07. [NPR]
GNESD, 2006: Electricity and development in Africa, Asia and Latin America. Consolidated Report of regional workshop on Global Network on Sustainable Development (GNESD), January, < www.gnesd.org/Downloadables/GnesdRegionalWorkshop.pdf > accessed 05/06/07. [NPR]
Goldemberg, J., 2004: The case for renewable energies. Thematic background paper, International Conference for Renewable Energies, Bonn, June, <www.renewables2004.de> accessed 05/06/07. [NPR]
Goldemberg, J. and T.B. Johansson, 2004: World Energy Assessment; Overview 2004 update. United Nations Development Programme, USA, 88 pp. [NPR]
Goldemberg, J., T.B. Johansso, A.K.N. Reddy, and R.H. Williams, 2004: A global clean cooking fuel initative. Energy for Sustainable Development, 8(3), pp. 5-12. Clean
Greenpeace, 2006: Solar generation. K. McDonald (ed.), Greenpeace International, Amsterdam. [NPR]
Greenfuels, 2004: Greenfuels Technology Corp. announces first field results from MIT Cogeneration plant beta test site. CK Test report, < http://www.greenfuelonline.com/gf_files/CK_Test_Report.pdf > accessed 05/06/07. [NPR]
Greenshift, 2005: Greenshift acquires rights to patented carbon dioxide reduction technology. < http://www.greenshift.com/news.php?id=97 > accessed 05/06/07. [NPR]
Greenpeace, 2004: http://www.greenpeace.org.ar/cop10ing/SolarGeneration.pdf accessed 05/06/07. [NPR]
Gul, T., and T. Stenzel, 2005: Variability of wind power and other renewables - management options and strategies. International Energy Agency working paper, OECD/IEA, Paris. [NPR]
GWEC, 2006: Global wind energy outlook. Global Wind Energy Council, Bruxelles and Greenpeace, Amsterdam, September, 56 pp., < www.gwec.net > accessed 05/06/07. [NPR]
Haas, R., 2002: Building PV markets: the impact of financial incentives. Journal Renewable Energy World, 5(4), pp. 184-201. Clean
Hagen, R.E, J.R. Moens, and Z.D. Nikodem, 2005: Impact of U.S. nuclear generation on greenhouse gas emissions. Energy Information Administration, U.S. Department of Energy, < http://tonto.eia.doe.gov/FTPROOT/nuclear/ghg.pdf > accessed 05/06/07. [NPR]
Hall, C., P. Tharakan, J. Hallock, C. Cleveland, and J. Jefferson, 2004: Hydrocarbons and the evolution of human culture. November, Nature, 426, pp. 318-322, <www.nature.com/nature> accessed 05/06/07. [JoC]
Hall, D.O., 2003: Electricity in Latin America. Public Services International Research Unit (PSIRU), London UK, 16 pp. [NPR]
Hall, D.O. and E. Lobina, 2004: Private and public interests in water and energy. Natural Resources Forum 28, pp. 286-277. Clean
Hallock, J.L, Tharakan P.J., C.A.S. Hall, M. Jefferson, and W. Wu, 2004: Forecasting the limits to the availability and diversity of global conventional oil supply. Energy, 29, pp. 1673-1696, Elsevier. [MoS]
He, J.K., A.L. Zhang, and C.S. Shang, 2006: Assessment of GHG mitigation using INET energy systems model. Journal of Tsinghua University, 36(10), pp. 68-73. [MoS]
He, J.K. and X.L. Zhang, 2006: Analysis of China’s energy consumption intensity reduction tendency during the 11th Five-Year-Plan period. China Soft Science, 184, pp. 33-38, April. Clean
Helynen, S., 2005: Distributed generation for sustainable development. Proceedings on Technologies for Sustainable Energy Development in the Long Term, L. Peterson and H. Larsen (eds.), Risoe-R-1517(EN), 459 pp., < www.risoe.dk/rispubl/SYS/ris-r-1517.htm > accessed 05/06/07. [NPR]
Hendriks, C., W. Graus and F. van Bergen, 2004: Global carbon dioxide storage potential. Ecofys, TNO, Utrecht, Netherlands. [NPR]
Herzog, A.V., T.E. Lipman, J.L. Edwards, and D.M. Kammen, 2001: Renewable energy: a viable choice. Environment, 43(10). Clean
Hirsch, R.L., R. Bezdek, and R. Wendling, 2005: Peaking of world oil production: impacts, mitigation, and risk management. Report to the American Administration, Washington D.C. [NPR]
Hondo, H., 2005: Life cycle GHG emission analysis of power generation system: Japanese case. Energy, 30, pp. 2042-2056. Clean
Huijer, K., 2005: Trends in oil spills from tanker ships 1995-2004: International Tanker Owners Pollution Federation (ITOPF). London. [NPR]
Huttunen, J., 2005: Long-term net methane release from Finnish hydro reservoirs. Global Warming and Hydroelectric Reservoirs, CDD 363.73874, pp. 125-127. [NPR]
Hydro Tasmania, 2005: Sustainable guidelines for hydro power developments. Produced by Hydro Tasmania for the International Hydro Power Association. [NPR]
IAEA, 1997: Joint convention on the safety of spent fuel management and on the safety of radioactive waste management. INFCIRC/546, 24 December 1997 (entered into force on 18 June 2001); < http://www.iaea.org/Publications/Documents/Infcircs/1997/infcirc546.pdf > accessed 05/06/07. [NPR]
IAEA, 1994: Convention on nuclear safety. International Atomic Energy Agency < http://www.iaea.org/Publications/Documents/Infcircs/Others/inf449.shtml > accessed 05/06/07. [NPR]
IAEA, 2005a: Thorium fuel cycle - potential benefits and challenges. International Atomic Energy Agency, Vienna 2005: <www-pub.iaea.org/MTCD/publications/PDF/TE_1450_web.pdf> accessed 05/06/07. [NPR]
IAEA, 2005b: Draft safety requirements: geological disposal of radioactive waste. Report no. WS-R-4, International Atomic Energy Agency, Vienna 2005, < http://www-pub.iaea.org/MTCD/publications/PDF/Pub1231_web.pdf > accessed 05/06/07. [NPR]
IAEA, 2005c: Energy, electricity and nuclear power estimates for the period up to 2030. Reference Data Series No.1, International Atomic Energy Agency, ISBN 92-0-1011-4289, July, Vienna, Austria. [NPR, MoS]
IAEA, 2006: Power reactor information system (PRIS). < http://www.iaea.org/programmes/a2/ > accessed 05/06/07. [NPR]
IEA, 2000: Experience curves for energy policy assessment. International Energy Agency, Paris, pp. 127. [NPR]
IEA, 2001: Impact of sustained high oil prices on developing countries. International Energy Agency Economic Analysis Division Working Party, Publication Service, OECD, Paris, France. [NPR]
IEA, 2003a: From oil crisis to climate challenge - understanding CO2 emission trends in IEA countries. International Energy Agency, OECD Publication Service, Paris, 22 pp. [NPR]
IEA, 2003b: Economies in transition, the IEA and renewable energy. Public Information Forum, International Energy Agency, Renewable Energy Working Party, Budapest, Hungary, OECD, Paris. < http://www.iea.org/dbtw-wpd/textbase/work/2003/budapest/background.pdf > accessed 05/06/07. [NPR]
IEA, 2003c: Energy to 2050: scenarios for a sustainable future. International Energy Agency, OECD, Paris. [NPR, MoS]
IEA, 2003d: Building the cost curves for the industrial sources of non-CO2 greenhouse gases. Greenhouse Gas R&D Programme, Report No. PH4/25, OECD, Paris, <www.iea.org> accessed 05/06/07. [NPR]
IEA, 2003e: Developments in the international coal market in 2001-2. Coal Industry Advisory Board, International Energy Agency, OECD, Paris, < http://www.iea.org/textbase/papers/2002/ciabmark.pdf > accessed 05/06/07. [NPR]
IEA, 2003f: National Survey Report of PV Power Applications in Japan 2002. Prepared by Kiyoshi Shino, Osamu Ikki, Tokyo, Japan, 27, International Energy Agency, Paris. [NPR]
IEA, 2003g: Proceedings of the seminar Towards Hydrogen - R & D priorities to create a hydrogen infrastructure. OECD, Paris. [NPR]
IEA, 2003h: Technology innovation, development and diffusion. Information paper, International Energy Agency, OECD, Paris. [NPR]
IEA, 2004a: World Energy Outlook 2004: International Energy Agency, OECD Paris. [NPR]
IEA, 2004b: Renewable energy - market and policy trends in IEA countries. International Energy Agency, OECD, Paris. <www.iea.org/textbase/nppdf/free/2004/renewable1.pdf> accessed 05/06/07. [NPR]
IEA, 2004c: Policies of IEA countries - 2004 review. International Energy Agency, Publication Service, OECD, Paris, 539 pp, < http://www.oecd.org/dataoecd/25/9/34008620.pdf > accessed 02/07/07. [NPR]
IEA, 2004d: Renewable Energy Working Party workshop Distributed generation- key issues, challenges, roles for its integration into mainstream energy systems, 1 March 2004: International Energy Agency, OECD, Paris. <www.iea.org> accessed 02/07/07. [NPR]
IEA, 2004e: Coming in from the cold - improving district heating policy in transition economies. International Energy Agency, OECD, Paris. [NPR]
IEA Bioenergy, 2005: Benefits of bioenergy. International Energy Agency, < http://www.ieabioenergy.com/library/179_BenefitsofBioenergy.pdf > accessed 02/07/07. [NPR]
IEA, 2005a: World Energy Outlook 2005: Middle East and North Africa Insights. International Energy Agency, OECD, Paris. [NPR]
IEA, 2005b: International Energy Agency, OECD, Paris, < http://www.iea.org/Textbase/stats/ > accessed 02/07/07. [NPR]
IEA, 2005c: Renewables information 2005. International Energy Agency, OECD Paris. [NPR]
IEA, 2005d: Energy to 2050: scenarios for a sustainable future. International Energy Agency, OECD Paris. [NPR, MoS]
IEA, 2005e: Resources to reserves: oil and gas technologies for the energy markets of the future. International Energy Agency, Paris (books@iea.org). [NPR, MoS]
IEA, 2005f: Hydrogen implementing agreement. International Energy Agency, OECD, Paris. [NPR]
IEA, 2005g: Prospects for hydrogen and fuel cells. International Energy Agency, OECD, Paris. [NPR]
IEA, 2006a : Global energy technology perspectives, International Energy Agency, OECD, Paris. < www.iea.org > accessed 02/07/07. [NPR]
IEA, 2006b: World energy outlook 2006. International Energy Agency, OECD Publication Service, OECD, Paris. < www.iea.org > accessed 02/07/07. [NPR]
IEA, 2006c: Key world energy statistics. < http://www.iea.org/textbase/nppdf/free/2006/key2006.pdf > accessed 02/07/07. [NPR]
IEA, 2006d: Renewable energy RD & D priorities report. International Energy Agency, OECD, Paris. < www.iea.org > accessed 02/07/07. [NPR]
IEA, 2006e: Policies and measures database. International Energy Agency, OECD, Paris, < www.iea.org > accessed 02/07/07. [NPR]
IEA, 2006f: Renewable energy heating and cooling. Seminar proceedings, April, International Energy Agency, OECD, Paris. < www.iea.org > accessed 02/07/07. [NPR]
IEA, 2006g : Contribution of renewables to energy security. Ölz S, Sims R E H and Kirchner N, Information report, International Energy Agency, OECD, Paris. <www.iea.org> [NPR]
IEA, 2006h: Bioenergy Implementing Agreement. International Energy Agency, OECD Paris, < http://www.joanneum.at/iea-bioenergy-task38/publications/faq/ > accessed 02/07/07. [NPR]
IEA, 2006j: Prospects for hydrogen and fuel cells. International Energy Agency, OECD, Paris. [NPR]
IEA/NEA, 2005: Projected costs of generating electricity - 2005 update. Joint Report, Nuclear Energy Agency and International Energy Agency, IEA/OECD, Paris. [NPR]
IEEJ, 2005: Handbook of energy & economic statistics in Japan. The Energy Data and Modelling Centre, Institute of Energy Economics, Japan. [NPR, MoS]
IIASA, 1998: Energy in a finite world, paths to a sustainable future. International Institute for Applied Systems Analysis, Vienna, Ballinger Publishing Company, ISBN 0-88410-641-1, 225 pp. [NPR, MoS]
IIASA/WEC, 1998: Global Energy Perspectives. N. Nakicenovic, A. Grübler, and A. McDonald, (eds.), International Institute for Applied Systems Analysis, Vienna, and World Energy Council, Cambridge University Press, 1998. [NPR]
IHA, 2006: Sustainability assessment protocol. International Hydropower Association, < www.hydropower.org > accessed 02/07/07. [NPR]
IMF, 2001: International Monetary Fund, the Democratic Republic of Congo. 2001 article iv consultation and discussions on staff-monitored program, Country Report No. 01/114, Washington D.C. [NPR]
IPCC, 1997: Revised 1996 IPCC guidelines for national greenhouse gas inventories. Intergovernmental Panel on Climate Change (IPCC), Volume 3. [NPR]
IPCC, 2001: Climate Change 2001: Mitigation - Contribution of Working Group III to the Third Assessment Report of the Intergovernmental Panel on Climate Change (IPCC) [Metz, B., O. Davidson, R. Swart, and J. Pan (eds.)]. Cambridge University Press, Cambridge, 700 pp. [NPR]
IPCC, 2005: IPCC special report on Carbon dioxide Capture and Storage. Prepared by Working Group III of the Intergovernmental Panel on Climate Change [Metz, B., O. Davidson, H.C. de Coninck, M. Loos and L.A. Meyer (eds.)], Cambridge University Press, Cambridge, United kingdom and New York, NY, USa, 442 pp. [NPR]
IPCC, 2006: IPCC Guidelines for national greenhouse gas inventories. Report of the Intergovernmental Panel on Climate Change, Cambridge University Press, Cambridge. < http://www.ipcc-nggip.iges.or.jp/public/2006gl/index.htm > accessed 02/07/07. [NPR]
IRIN, 2004: Angola: frustration as oil windfall spending neglects the poor. United Nations Integrated Regional Information Networks, < http://www.irinnews.org/report.asp?ReportID=43013 & SelectRegion=Southern_Africa > accessed 02/07/07. [NPR]
ISES, 2005: Proceedings on International Solar Energy Society (ISES). 2005 Solar World Congress, D.Y. Goswami, S. Vijayaraghaven, and R. Campbell-Howe R (eds.), Orlando, Florida, August. [NPR]
ISNA, 2004: From wood to coal in an effort to stop deforestation. Inter Services news agency (IPS), Rome, < http://www.ipsnews.net/interna.asp?idnews=25947 > accessed 02/07/07. [NPR]
ITDG, 2003: Sustainable energy for poverty reduction: an action plan. ISES, 2005: Proceedings of the International Solar Energy Society (ISES), 2005 Solar World Congress, D. Goswami, D.Y. Vijayaraghaven, and R. Campbell-Howe (eds.), Orlando, Florida, August. [NPR]
ITER, 2006: International Thermonuclear Experimental Reactor (ITER). < http://www.iter.org/ > accessed 02/07/07. [NPR]
Jack, D., 2004: Income, household energy and health. Kennedy School of Government, Harvard MA, 16 pp. [NPR]
JAEC, 2005: Framework for nuclear energy policy. Japan Atomic Energy Commission < http://www.aec.go.jp/jicst/NC/tyoki/tyoki_e.htm > accessed 02/07/07. [NPR]
Jaffe, A.B., R.G. Newell, and R.N. Stavins, 2005: A tale of two market failures - technology and environmental policy. Ecological Economics, 54, pp. 164-174. Clean
Jäger-Waldau, A., 2003: PV status report 2003 - research, solar cell production and market implementation in Japan, USA and European Union. Joint Research Centre, European Commission. [NPR]
Janssen, R., 2002: Renewable energy into the mainstream. International Energy Agency, Publication Service, OECD, Paris, France, 54 pp. [NPR]
Jimison, J., 2004: The advantages of combined heat and power. Workshop on Distributed Generation and Combined Heat and Power, April, EPRI (Electric Power Research Institute), Palo Alto, California. [NPR]
Jochem, E. and R. Madlener: 2002: The forgotten benefits of climate change mitigation: innovation, technological leapfrogging, employment and sustainable development. OECD Workshop on the Benefits of Climate policy: Improving Information for Policy Makers, 12-13 December, Paris, France. [NPR, ARC]
Johansson, T.B., 2004: The potentials of renewable energy: thematic background paper, Renewables, 2004. International Conference for Renewable Energies, Bonn, http://www.renewables2004.de/pdf/tbp/TBP10-potentials.pdf > accessed 02/07/07. [NPR]
Johansson, T.B. and W. Turkenburg, 2004: Policies for renewable energy in the European Union and its member states - an overview. Energy for Sustainable Development, VIII(1), pp. 5-24. Clean
Johansson, T.B., K. McCormick, L. Neij, and W. Turkenburg, 2004: The potentials of renewable energy, Thematic background paper for International conference “Renewables2004”, Bonn, June, <www.renewables2004.de> accessed 02/07/07. [NPR]
Jönsson, 2004: [website] < http://www.novaenergie.ch/iea-bioenergy-task37/Dokumente/06%20biogasupgrading.pdf > accessed 02/07/07. [NPR]
Kamman, D.M., K. Kapadia, and M. Fripp, 2004: Putting renewables to work: how many jobs can the clean energy industry generate? Renewable and Appropriate Energy Laboratory (RAEL) report, University of California, Berkeley, 24 pp. [NPR]
Kantei, 2006: < http://www.kantei.go.jp/foreign/policy/kyoto/050428plan_e.pdf > accessed 02/07/07. [NPR]
Karekezi, S. and W. Kithyoma, 2003: Renewable and rural energy overview in sub-Saharan Africa. African Energy Policy Research Network (AFREPREN)/FWD Secretariat, Nairobi, Kenya. [NPR]
Karl, T.L. and I. Gary, 2004: The global record. Petropolitics special report, January 2004: Foreign Policy in Focus (FPIF), Silver City, New Mexico and Washington D.C., 8 pp. [NPR]
Kessels, J.R. and S.J.A. Bakker, 2005: ESCAPE: energy security & climate policy evaluation. ECN-C--05-032, ECN, Petten, Netherlands, < http://www.ecn.nl/library/reports/2005/c05032.html > accessed 02/07/07. [NPR]
Kessides, I.N., 2004: Reforming infrastructure privatisation regulation and competition. World Bank policy research report, a co-publication of World Bank and Oxford University Press, Oxford, UK. [NPR]
Kirjavainen, M., T. Savola, and M. Salomon, 2004: Small scale biomass CHP technologies: situation in Finland, Sweden and Denmark. OPET report 12, contract to European Commission, Directorate General for Energy and Transport, < http://www.opet-chp.net/download/wp2/small_scale_biomass_chp_technologies.pdf > accessed 02/07/07. [NPR]
Komiyama, R., Z. Li and K. Ito, 2005: World energy outlook in 2020 focusing on China’s energy impacts on the world and Northeast Asia. International Journal on Global Energy Issues, 24(3/4), pp. 183-210. Clean
Koster, A., H.D. Matzner, and D.R. Nichols, 2003: PBMR design for the future. Nuclear Engineering and Design, 222(2-3) pp. 231-245, June. [MoS]
Krogsgaard, O.T., 2001: Energiepolitiken som vinden blaeser, (Energy policy as the wind blows). Politiken, 14 January. [NPR]
Lang, Q., R.S. Chapman, D.M. Schreinemachers, L. Tian and X. He, 2002: Household stove improvement and risk of lung cancer in Xuanwei China. Journal of the National Cancer Institute, 94(11), pp. 826-834. Clean
Larson, E.D. and H. Yang, 2004: DME from coal as a household cooking fuel in China. Energy for Sustainable Development, 8(3), pp. 115-126. [ARC]
Larson, E.D., Z.X. Wu, P. Delaquil, W.Y. Chen, and P.F. Gao, 2003: Future implications of China-technology choices. Energy Policy, 31(12), pp. 1189-1204. [MoS, ARC]
Lauber, V., 2004: REFIT and RPS: options for a harmonized community framework. Energy Policy, 32(12), pp. 1405-1414. Clean
Leite, C. and J. Weidmann, 1999: Does mother nature corrupt? Natural resources, corruption and economic growth. IMF working paper WP/99/85, International Monetary Fund, Washington D.C. [NPR]
Linden, N.H., M.A. Uyterlinde, C. Vrolijk, L.J. Nilsson, J. Khan, K. Astrand, K. Ericsson, and R. Wiser, 2005: Review of international experience with renewable energy obligation support mechanisms. ECN, Petten, Netherlands, May 2005. [NPR]
London Health Commission, 2003: Energy and health: making the link. City Hall, London. [NPR]
Lort-Phillips, E. and V. Herrigshaw, 2006: Beyond the rhetoric, measuring transparency in the oil and gas industry. In Global Corruption Report 2006: Transparency International, Pluto Press, London. [NPR]
Lovei, L. and A. McKechnie, 2000: The costs of corruption for the poor - the energy sector, public policy for the private sector. Note no. 207, The World Bank, Washington D.C. [NPR]
Luther, J., 2004: Research and development - the basis for wide-spread employment of renewable energies. International Conference for Renewable Energies, thematic background paper, Bonn, June, < www.renewables2004.de > accessed 02/07/07. [NPR]
Maeda, H., 2005: The global nuclear fuel market - supply and demand 2005-2030. WNA Market Report, World Nuclear Association Annual Symposium 2005, < http://world-nuclear.org/sym/2005/maeda.htm > accessed 02/07/07. [NPR]
Mago, R., 2004: Nuclear power - an option to meet the long term electricity needs of the country. Nuclear Power Corporation of India Ltd, Mumbai, India. [NPR]
Margolis, R.M. and D.M. Kammen, 1999: Underinvestment: the energy technology and R&D policy challenge. Science, 285, pp. 690-692. [JoC]
Martinot, E. (lead author) et al, 2005: Renewables 2005: Global status report. REN21 Renewable Energy Policy Network, < http://www.ren21.net/globalstatusreport/g2005.asp > accessed 02/07/07. [NPR, SRC]
Martinot, E. et al., 2006: Renewables 2006 global status report. REN21 Renewable Energy Policy Network, www.ren21.net/globalstatusreport/issuesGroup.asp accessed 02/07/07. [NPR, SRC]
Maycock, P., 2003: PV market update. Journal Renewable Energy World, 6(4), July/August 2003, pp. 84-101. Clean
Mazza, P. and R. Hammerschlag, 2003: Carrying the energy future: comparing hydrogen and electricity for transmission, storage and transportation. Institute for Lifecycle Environmental Assessment, Seattle, Washington, 98122-0437, < www.ilea.org > accessed 02/07/07. [NPR, MoS]
McDonald, A. and D. Schrattenholzer, 2001: Learning rates for energy technologies. Journal of Energy Policy, 29, pp. 255-261. Clean
MCH/WLPGA, 2005: Statistical Review of global LP gas. MCH Oil & Gas Consultancy/World LP Gas Association. [NPR]
Menanteau, P., F.D. Land, and M-L. Lamy, 2001: Prices versus quantities: Environmental policies for promoting the development of renewable energy. Institut d’Economie et de Politique de l’Energie (IEPE) report, May 2001: Grenoble, France, 23 pp. [NPR]
Menanteau, P., D. Finon, and M-L. Lamy, 2003: Prices versus quantities: choosing policies for promoting the development of renewable energy. Energy Policy, 31, pp. 799-812. Clean
METI, 2005: Japan’s Energy Outlook 2030. Ministry of Economy, Trade and Industry, Japan. [NPR]
MIT, 2003: The future of nuclear power. An interdisciplinary MIT study, Massachusetts Institute of Technology, E.J. Moniz and J. Deutch, Co-Chairs, < http://web.mit.edu/nuclearpower/ > accessed 02/07/07. [NPR, MoS]
Mishra, V., 2003: Indoor air pollution from biomass combustion and acute respiratory illness in preschool age children in Zimbabwe. International Journal of Epidemiology, 2003(32), pp. 847-853. Clean
Monirul, Q.M.M., 2004: Climate change and the Canadian energy sector: report on vulnerability impact and adaptation. Environment Canada. [NPR]
Moore, T., 2005: Coal based generation at the crossroads. EPRI Journal, Summer, Palo Alto, CA. [NPR]
Morthorst, P.E., 2004: Wind power - status and perspectives. In Future Technologies for a Sustainable Electricity System, Cambridge University Press, Cambridge. [NPR, MoS]
Nalbandian, H., 2002: Prospects for integrated pollution control in pulverised coal-fired power plant. International Energy Agency, Clean Coal Centre, London. [NPR]
NCOE, 2004: Ending the Energy Stalemate. National Commission on Energy Policy, Department of Energy, Washington D.C., 148 pp. [NPR]
NDA, 2006: Strategy. Nuclear Decommissioning Authority, April, < http://www.nda.gov.uk/documents/loader.cfm?url=/commonspot/security/getfile.cfm & pageid=4957 > accessed 02/07/07. [NPR]
NEB, 2006: Oil sands - opportunities and challenges to 2015. Canadian National Energy Board < www.neb.gc.ca > accessed 02/07/07. [NPR]
NEI, 2006: Nuclear facts. Nuclear Energy Institute, < http://www.nei.org/doc.asp?catnum=2 & catid=106 > accessed 02/07/07. [NPR]
Nel, W., 2003: Feasibility of energy plant in Agulhas ocean current. Eskom Report No RES/SC/03/22509, Eskom Holdings Ltd., Johannesburg. [NPR]
NER, 2004: National integrated resource plan 2003/4: reference case. ISEP * Eskom (Resources and Strategy), Energy Research Institute, University of Cape Town and the National Electricity Regulator, Pretoria, <www.ner.org.za> accessed 02/07/07. [NPR]
NERI, 2004: Investigations of migratory birds during operation of Horns Rev offshore wind farm. National Environmental Research Institute, Ministry of the Environment, Denmark. [NPR]
Netalieva, I., J. Wesseler, and W. Heijman, 2005: Health costs caused by oil extraction air emissions and the benefits from abatement: the case of Kazakhstan. Energy Policy, 33, pp. 1169-1177. Clean
Neuhoff, K., 2004: Large scale deployment of renewables for electricity generation. Publication Service, OECD, Paris, France, 40 pp. [NPR]
Newman, J., N. Beg, J. Corfee-Morlot, G. McGlynn, and J. Ellis, 2002: Climate change and energy: trends, drivers, outlook and policy options. OECD Publication Service, Paris, France, 102 pp. [NPR]
NREL, 2005: Renewable Energy Cost Trends. Golden Colorado, < www.nrel.gov/analysis/docs/cost curves 2005.ppt > accessed 02/07/07. [NPR]
Nuclear News, 2005: WNA report forecasts three scenarios for nuclear’s growth. Nuclear News, November 2005: pp. 60-62, 69. [MoS]
OECD, 2000: The radiological impacts of spent nuclear fuel management options. Comparative study, OECD, Paris, < http://www.nea.fr/html/rp/reports/2000/nea2328-PARCOM-ENG.pdf > accessed 02/07/07. [NPR]
OECD, 2001: Trend in the nuclear fuel cycle, economic, environmental and social aspects. OECD, Paris. < http://www1.oecd.org/publications/e-book/6602011e.pdf > accessed 02/07/07. [NPR]
OECD, 2002a: Dealing with climate change - policies and measure in IEA member countries, Organisation for Economic Cooperation and Development Publication Service, OECD, Paris, France, 151 pp. [NPR]
OECD, 2002b: Reforming energy subsidies. UN Environmental Programme and Organisation for Economic Cooperation and Development, OECD/IEA, Oxford, UK, 31 pp. [NPR]
OECD, 2003: Decommissioning nuclear power plants: policies, strategies and costs. OECD Nuclear Energy Agency, 105 pp. ISBN 92-64-10431-3. < http://www1.oecd.org/publications/e-book/6603221E.pdf > accessed 02/07/07. [NPR]
OECD, 2004a: Uranium 2003: resources, production and demand. Joint Report by the OECD Nuclear Energy Agency and the International Atomic Energy Agency, OECD, Paris. [NPR]
OECD, 2004b: Biomass and Agriculture - sustainability markets and policies. Organisation of Economic and Co-operative Development, Paris, ISBN 92-64-10555-7. [NPR]
OECD, 2006a: Global science forum on scientific challenges for energy research. Paris, May, < www.oecd.org/sti/gsf/energy > accessed 02/07/07. [NPR]
OECD, 2006b: Uranium 2005: resources, production and demand. Joint Report by the OECD Nuclear Energy Agency and the International Atomic Energy Agency, OECD/NEA, ISBN: 92-64-02425-5388 pp. [NPR]
OECD, 2006c: Advanced nuclear fuel cycles and radioactive waste management. ISBN: 92-64-02485-9, OECD/NEA, 248 pp. [NPR]
OECD/IEA, 2005: Legal aspects of storing CO2. Joint International Energy Agency / Carbon Sequestration Leadership Forum workshop, Paris, July 2004. [NPR]
OFGEM, 2005: Renewables Obligation - an overview of the second year. Office for Gas and Electricity Markets, http://www.ofgem.gov.uk/Media/FactSheets/Documents1/9693-renewablesfsupdatefeb05.pdf > accessed 02/07/07. [NPR]
Olsen, K.H. and J. Fenhann, 2006: Sustainable development benefits of clean development projects. CD4CDM Working Paper Series, Working Paper No. 2, Risoe, October 2006 [NPR, SRC]
Outhred, H. and I. MacGill, 2006: Integrating wind energy in the Australian National Electricity market. Proceedings of the World Renewable Energy Congress IX, August, ISBN 008 44671 X. [NPR]
Oxera, 2005: What is the impact of limiting ROC eligibility for low-cost renewable generation technologies? Final report to the Department of Trade and Industry, London, 44 pp. Oxera Consulting Ltd, Oxford. [NPR]
Patrinos, A., 2006: The promises of biotechnology. Synthetic Genomics Inc, USA, paper, OECD conference Scientific Challenges for Energy Research, Paris, 17-18 May. [NPR]
Philibert, C., 2004: Case study 1: concentrating solar power technologies. International Energy Technology Collaboration and Climate Change Mitigation, OECD Environmental Directorate, IEA, Paris. [NPR]
Philibert, C. and J. Podkanski, 2005: International energy technology collaboration and climate change mitigation case study 4: clean coal technologies. International Energy Agency, Paris. [NPR]
Philibert, C., 2006: Barriers to the diffusion of solar thermal technologies. OECD and IEA Information Paper, International Energy Agency, Paris. [NPR]
Plouchart, G., A. Fradet, and A.Prieur, 2006: The potential of CO2 Capture and Storage of worldwide electricity related greenhouse gases emissions in oil and gas fields. Paper at the 8th Greenhouse gas technologies conference, June 19 - 22, 2006: Trondheim, Norway. [NPR]
Price, L. and S. de la Rue du Can, 2006: Sectoral trends in global energy use and greenhouse gas emissions. Lawrence Berkeley National Laboratory, LBNL-56144. [NPR, ARC]
Ragwitz, M., J. Schleich, C. Huber, G. Resch, T. Faber, M. Voogt, R. Coenraads, H. Cleijne, and P. Bodo,.2005: Analyses of the EU renewable energy sources’ evolution up to 2020 (FORRES 2020, Fraunhofer Institute, Karlsruhe, Germany.. [NPR]
Read, P. and J.R. Lermit, 2005: Bioenergy with carbon storage(BECS): a sequential decision approach to the threat of abrupt climate change. Energy, 30(14), pp. 2654-2671. [ARC]
Renewables, 2004: International Conference for Renewable Energies. Proceedings, Conference Report, Outcomes and Documentation, Political Declaration/International Action Programme/Policy Recommendations for Renewable Energy, 1-4 June 2004, Bonn, Germany, 54 pp., < www.renewables2004.de > accessed 02/07/07. [NPR]
Ristau, O., 2003: Sunny prospects on the Costa del Sol. Journal New Energy, 3(2003), pp. 48-50. Clean
Roques, F.A., W. J. Nuttall, D.M. Newbery, R. de Neufville, and S. Connors, 2006: Nuclear power: a hedge against uncertain gas and carbon prices? The Energy Journal, 27(4), pp. 1-23. Clean
Rogner, H.H., 2003: Nuclear power and climate change. World Climate Change Conference (WCCC), Moscow (20 September-3 October), < http://www.world-nuclear.org/wgs/cop9/cop-9_holger.pdf > accessed 02/07/07. [NPR, ARC]
Royal Academy of Engineering, 2004: The cost of generating electricity. ISBN 1-903496-11-X, London, < http://www.nowap.co.uk/docs/generation_costs_report.pdf > accessed 02/07/07. [NPR]
Sagie, D., 2005: Feasibility study of 100MWe solar power plant. Proceedings of the International Solar Energy Society (ISES), 2005 Solar World Congress, D.Y. Goswami, S. Vijayaraghaven, and R. Campbell-Howe (eds.), Orlando, Florida, August. [NPR]
Saunders, A. and K. Schneider, 2000: Removing energy subsidies in developing and transition economies, energy markets and the new millennium: Economic Environment, Security of Supply. 23rd Annual IAEE International Conference, Sydney, Australia, 21 pp. [NPR]
Sawin, J.L, 2003a: National policy instruments: policy lessons for the advancement & diffusion of renewable energy technologies around the world. Thematic background paper, pp. 56, International Conference for Renewable Energies, 1-4 June 2004: Bonn, Germany, <www.renewables2004.de> accessed 02/07/07. [NPR]
Sawin, J.L., 2003b: Charting a new energy future, in State of the World 2003. L. Starke, W.W. Norton and Company (eds.), New York, pp 85-109. [NPR, MoS]
Schlamadinger, B., R. Edwards, K.A. Byrne, A. Cowie, A. Faaij, C. Green, S. Fijan-Parlov, L. Gustavsson, T. Hatton, N. Heding, K. Kwant, K. Pingoud, M. Ringer, K. Robertson, B. Solberg, S. Soimakallio, and S. Woess-Gallasch, 2006: Optimizing the greenhouse gas benefits of bioenergy systems. Proceedings of the 14th European Biomass Conference, 17-21 October 2005: Paris, France, pp. 2029-2032. [NPR, SRC]
Sekar, R.S., 2005: Carbon dioxide capture from coal-fired power plants: a real options analysis. MSc Thesis, MIT. < http://sequestration.mit.edu/pdf/LFEE_2005-002_RP.pdf > accessed 02/07/07. [NPR]
Shell, 2006: Sustainable choices, stakeholder voices: 2005. Sustainable Development Report, pp. 36. [NPR]
Shorrock, T., 2002: Enron’s Asia misadventure. Asia Times 29 January, < http://www.atimes.com/global-econ/DA29Dj01.html > accessed 02/07/07. [NPR]
Sikar, E., 2005: Greenhouse gases and initial findings on the carbon circulation in two reservoirs and their watersheds. Verhandlung Internationale Vereinigung für Limnologie, 27. [NPR]
Sims, R.E.H., 2002: The Brilliance of Bioenergy - the business and the practice. James & James, (Science Publishers) London, 316 pp. ISBN 1-902916-28-X. [NPR, SRC]
Sims, R.E.H., 2003: Renewable energy - a response to climate change. Proceedings of the International Solar Energy Society World Congress 2001: Adelaide, W.Y. Saman and W.W.S. Charters (eds.), Australian and New Zealand Solar Energy Society, 1, pp. 69-79. [SRC]
Sims, R.E.H., H-H. Rogner, and K. Gregory, 2003a: Carbon emission and mitigation cost comparisons between fossil fuel, nuclear and renewable energy resources for electricity generation. Energy Policy, 31, pp. 1315-1326. [SRC]
Sims, R.E.H., N. El Bassam, R.P. Overend, K.O. Lim, K. Lwin and P. Chaturvedi, 2003b: Bioenergy options for a cleaner environment - in developed and developing countries. Elsevier, Oxford, 184 pp., ISBN 0 08 0443516. [NPR, SRC]
Sims, R.E.H., 2004: Biomass, Bioenergy and Biomaterials - future prospects, ‘Biomass and Agriculture - sustainability markets and policies’. Pp. 37-61 ISBN 92-64-10555-7. OECD, Paris. [NPR, MoS, SRC]
Singh, V. and J. Fehrs, 2001: The work that goes into renewable energy. Research Report, Renewable Energy Policy Project (REPP), November 2001: No.13, 28, Washington D.C. [NPR]
Sloss, L., C. Henderson, and J. Topper, 2003: Environmental standards and controls and their influence on development of clean coal technologies. International Energy Agency Clean Coal Centre, London. [NPR]
Smith, K.R., 2002: Indoor air pollution in developing countries: recommendations for research. Indoor Air, 12, pp. 198-207. Clean
Smith, K.R., J. Zhang, R. Uma, W.N. Kishore, V. Joshi, and M.A.K. Khalil, 2000a: Greenhouse implications of household fuels: an analysis for India. Annual Review of Energy and Environment 25, pp. 741-763. Clean
Smith, K.R., J.M. Samet, I. Romieu, and N. Bruce, 2000b: Indoor air pollution in developing countries and acute lower respiratory infections in children. Thorax, 55, pp. 518-532. Clean
Smith, S., A. Brenket, and J. Edmonds, 2006b: Biomass with carbon dioxide capture and storage in a carbon-constrained world. GHGT8 proceedings, Trondheim, Norway. [NPR, ARC]
Snow, T., White House Press Briefing, 2006: < http://www.whitehouse.gov/news/releases/2006/10/20061031-8.html > , < http://www.whitehouse.gov/news/releases/2006/10/20061031-8.html# > accessed 31 October 2006. [NPR]
Spadaro K, 2000: Greenhouse gas emissions of electricity generation chains - Assessing the difference. International Atomic Energy Agency (IAEA) Bulletin 42/2/2000. [NPR]
Specker, S., 2006: Generation technologies in a carbon-constrained world. Electric Power Research Institute, Palo Alto, California, March. [NPR]
Stern, N., 2006: The economics of climate change. < http://www.hm-treasury.gov.uk/independent_reviews/stern_review_economics_climate_change/sternreview_index.cfm > accessed 02/07/07. [NPR]
Stirling, 2005: Concentrated solar power development company. < http://www.stirlingenergy.com/news.asp?Type=stirling > accessed 02/07/07. [NPR]
Storm van Leeuwen, J.W. and P. Smith, 2005: Nuclear power: the energy balance, < http://www.stormsmith.nl/ > accessed 02/07/07. [NPR, ARC]
Swart, R., J. Robinson, and S. Cohen, 2003: Climate change and sustainable development: expanding the options. Climate Policy, 3S1, pp. 19-40. [JoC, ARC]
Testor, J.W., E.M. Drake, M.W. Golay, M.J. Driscoll, and W.A. Peters, 2005: Sustainable energy - choosing among options. MIT Press, Cambridge, Massachusetts. [NPR, SRC]
Tremblay, A. (ed.), 2005: Greenhouse gas emissions - fluxes and processes. Hydroelectric Reservoirs and Natural Environments. Springer, Berlin. [NPR]
Trieb, F., 2005: Concentrating solar power for the Mediterranean region (MED-CSP). Study prepared for the German Federal Ministry for the Environment, Nature Conservation and Nuclear Safety (BMU), March, < http://www.dlr.de/tt/ > accessed 02/07/07. [NPR]
Uchiyama, Y., 1996: Life cycle analysis of electricity generation and supply systems, Electricity, Health and the Environment: Comparative Assessment in Support of Decision Making. IAEA, Vienna. [NPR, SRC]
Uchiyama, Y. and H. Yamamoto, 1995: Life cycle analysis of power generation plants, CRIEPI report Y94009. [NPR, SRC]
UCS, 2005: Renewable electricity standards at work in the States. < http://www.ucsusa.org/clean_energy/clean_energy_policies/res-at-work-in-the-states.html > accessed 02/07/07. [NPR]
UKERC, 2006: The costs and impacts of intermittency. UK Energy Research Centre, Imperial College, London, ISBN 1 90314 404 3, < www.ukerc.ac.uk/content/view/259/953 > accessed 02/07/07. [NPR]
UN, 2000: General Assembly of the United Nations Millennium Declaration. 8th Plenary meeting, September, New York. [NPR]
UN, 2004: Integration of the economies in transition into the world economy. A report on the activities of the Economic Commission for Europe, Department Policy and Planning Office, < http://www.un.org/esa/policy/reports/e_i_t/ece.pdf > accessed 02/07/07. [NPR]
UNDESA, 2002: The Johannesburg plan of implementation. United Nations Department of Economic and Social Affairs, New York. [NPR]
UNDP, 2000: Energy and the challenge of sustainability. World Energy Assessment, United Nations Development Programme, UNDESA and World Energy Council, ISBN 9211261260, New York, < http://www.undp.org/energy/activities/wea/drafts-frame.html > accessed 02/07/07. [NPR]
UNDP, 2004a: World energy assessment, overview 2004: an update of ‘Energy and the challenge of sustainability, world energy assessment’. Published in 2000: UNDESA/WEC, United Nations Development Program, New York. [NPR]
UNDP, 2004b: Access to modern energy services can have a decisive impact on reducing poverty. http://www2.undp.org.yu/files/news/20041119_energy_poverty.pdf > accessed 02/07/07. [NPR]
UNEP, 2004: Energy technology fact sheet, Cogeneration. UNEP Division of Technology, Industry and Economics - Energy and Ozone Action Unit, < http://www.cogen.org/Downloadables/Publications/Fact_Sheet_CHP.pdf > accessed 02/07/07. [NPR]
EP, 2006: The UNEP Risoe CDM/JI pipeline. October, < www.cd4cdm.org/Publications/CDMPipeline.xls > accessed 02/07/07. [NPR]
UNESCO, 2006: Workshop on GHG from freshwater reservoirs. 5-6 December, United Nations Educational, Scientific and Cultural Organization Headquarters, Paris, France, UNESCO IHP-VI website, < www.unesco.org/water/ihp/ > accessed 02/07/07. [NPR]
University of Chicago, 2004: The economic future of nuclear power. < http://www.anl.gov/Special_Reports/NuclEconAug04.pdf > accessed 02/07/07. [NPR, MoS]
UIC, 2005: Civil liability for nuclear damage. Uranium Information Centre, Nuclear Issues Briefing Paper # 70, December, < http://www.uic.com.au/nip70.htm > accessed 02/07/07. [NPR]
UNFCCC, 2004: Synthesis and assessment report of the greenhouse gas inventories submitted in 2004 from Annex-I countries. Pp. 66, 75, 93, and 94. [NPR]
UNFCCC, 2006: Definition of renewable biomass. Minutes of CDM EB23, Annex 18, < http://cdm.unfccc.int/EB/Meetings/023/eb23_repan18.pdf > accessed 02/07/07. [NPR]
USCCTP, 2005: United States Climate Change Technology Program, < http://www.climatetechnology.gov/library/2003/tech-options/ > accessed 02/07/07. [NPR]
US DOE, 2004: FutureGen-integrated hydrogen. Electric Power Production and Carbon Sequestration Research Initiative, < http://www.fossil.energy.gov/programs/powersystems/futuregen > accessed 02/07/07. [NPR, MoS]
US DOE, 2005: Projected benefits of federal energy efficiency and renewable energy programs (FY2006- FY2050), Long-term benefits analysis of EERE’s Programs (Chapter 5). Department of Energy, Washington D.C. [NPR]
US DOE, 2006: Global nuclear energy partnership (GNEP). < http://www.gnep.energy.gov/ > accessed 02/07/07. [NPR]
US EIA, 2004: Long term world oil supply. Washington D.C. < http://www.eia.doe.gov/pub/oil_gas/petroleum/presentations/2004/worldoilsupply/oilsupply04 > gevonden < http://tonto.eia.doe.gov/FTPROOT/features/longterm.pdf > accessed 02/07/07. [NPR]
US EIA, 2005: International energy outlook 2005. U.S. Energy Information Administration, Office of Integrated Analysis and Forecasting, U.S. Department of Energy, Washington, D.C., 186 pp, < http://www.eia.doe.gov/oiaf/ieo/index.html > accessed 03/07/07. [NPR, MoS]
US EPA, 2003: Assessment of the worldwide market potential for oxidizing coal mine ventilation air methane. United States Environmental Protection Agency, Washington D.C., July. [NPR]
USGS, 2000: United States Geological Survey, World Assessment Summary. [NPR]
USGS, 2004a: United States Geological Survey fact sheet, December 2. < http://marine.usgs.gov/fact-sheets/gas-hydrates/title.html > accessed 03/07/07. [NPR]
USGS, 2004b: United States Geological Survey fact sheet, December 1. < http://energy.usgs.gov/factsheets/Coalbed/coalmeth.html > accessed 03/07/07. [NPR]
US NAE 2004, The Hydrogen Economy: Opportunities, Costs, Barriers and R&D Needs, U.S. National Academy of Engineering, Washington, D.C., 2004. [NPR]
Vallette, J. and D. Wysham, 2002: Enron’s pawns - how public institutions bankrolled Enron’s globalization game. Sustainable Energy and Economy Network, Institute of Policy Studies, Washington D.C. [NPR]
Vate, J.F. van de, 2002: Full-energy-chain greenhouse-gas emissions: a comparison between nuclear power, hydropower, solar power and wind power. International Journal of Risk Assessment and Management 2002, 3(1), pp. 59-74. [NPR]
Vattenfall, 2005: Certified environmental product declaration of electricity from Forsmark NPP (updated 2005) and Ringhals NPP. S-P-00021& S-P-00026, June 2004. < http://www.environdec.com/reg/021/Chapters/Dokument/EPD-FKA-2005.pdf > , < http://www.environdec.com/reg/026/Chapters/Dokument/EPD-Ringhals.pdf > accessed 03/07/07. [NPR]
Venkataraman, C., G. Habib, A. Eiguren-Fernandez, A.H. Miguel, and S.K. Friedlander, 2004: Residential biofuels in South Asia: carbonaceous aerosol emissions and climate impacts, Science, 307(5714), pp.1454-1456. [JoC]
Venn, J., 2005: Rapid access to modern energy services using LP gas. Energy & Environment, 16(5), Multi-Science Publishing Co. Ltd., Brentwood. Clean
Verweij, M., 2003: Leaking pipelines - Shell in South Africa. The Globalization and Energy Project, Milieudefensie, Amsterdam, Netherlands, 17 pp. [NPR]
WADE, 2005: World survey of decentralized energy 2005. Edinburgh, UK, [NPR]
WADE, 2006: World survey of decentralized energy 2006. < www.localpower.org > accessed 03/07/07. [NPR]
Wamukonya, N., 2003: Power sector reform in developing countries: mismatched agendas. In Electricity Reform: Social and Environmental Challenges, N. Wamukonya (ed.), United Nations Environmental Programme, Roskilde, pp. 7-47. [NPR, SRC]
Wavegen, 2004: < www.wavegen.com > accessed 03/07/07. [NPR]
WBCSD, 2004: Energy and climate change - facts and trends to 2050. World Business Council for Sustainable Development, Geneva, Switzerland, < www.wbcsd.org > accessed 03/07/07. [NPR]
WCD, 2000: Dams and development - a new framework for decision making. World Commission on Dams, < www.dams.org > accessed 03/07/07. [NPR]
WEC, 2001: Performance of generating plant, World Energy Council, London. [NPR]
WEC, 2004a: Comparison of energy systems using life cycle assessment - special report. World Energy Council, July, London. [NPR]
WEC, 2004b: Oil and gas exploration & production: reserves, costs, contracts. Technip, 102 pp. [NPR]
WEC, 2004c: 2004 Survey of energy resources. World Energy Council, London. [NPR]
WEC, 2004d: Energy end-use technologies for the 21st Century. World Energy Council, London, UK, 128 pp., < www.worldenergy.org/wec-geis > accessed 03/07/07. [NPR]
Weiss, W., I. Bergmann, and G. Faninger, 2005: Solar heating worldwide: markets and contribution to energy supply. Solar Heating and Cooling Programme, International Energy Agency, Paris, < www.iea-shc.org > accessed 03/07/07. [NPR]
West, J.J., P. Osnaya, I. Laguna, J. Martínez, and A. Fernández, 2004: Co-control of urban air pollutants and greenhouse gases in Mexico City. Environmental Science and Technology, 38(13), pp. 3474 -3481. Clean
Whispergen, 2005: Small Stirling engine combined heat and power plants. Whispertech Company Ltd., Christchurch, New Zealand, < www.whispertech.co.nz > accessed 03/07/07. [NPR]
WHO, 2002: The world health report 2002 - reducing risks, promoting healthy life. World Health Organisation, Geneva, Switzerland, 248 pp. [NPR]
WHO, 2003: Exposure assessment in studies on the chronic effects of long-term exposure to air pollution. World Health Organisation report on a WHO/HEI Workshop, Bonn, Germany, 4-5 February 2002: Geneva, Switzerland. [NPR]
Williams, R.H., E.D. Larson, and H. Jin, 2006: Synthetic fuels in a world of high oil and carbon prices. Proceedings of the 8th International Conference on Greenhouse Gas Control Technologies, Trondheim, Norway, June. [NPR]
Wind Force 12, 2005: Global Wind Energy Council and Greenpeace, < http://www.gwec.net/index.php?id=8 > accessed 03/07/07. [NPR]
World Bank, 1998: Urban air quality management, pollution prevention and abatement handbook. Washington D.C. [NPR]
World Bank, 2004a: A voluntary standard for global gas flaring and venting reduction. The International Bank for Reconstruction and Development/The World Bank,Washington D.C. [NPR]
World Bank, 2004b: Striking a better balance - the World Bank group and extractive industries: the final report of the extractive industries review. Washington D.C., 52 pp. [NPR]
World Bank, 2005: An open letter to the Catholic Relief Services and bank information centre in response to the report ‘Chad’s Oil: Miracle or Mirage for the poor?’. News release no: 2005/366/AFR, Washington D.C. [NPR]
World Bank, 2006: Clean energy and development: towards an investment framework. Environmental and Socially Sustainable Development Vice Presidency, World Bank, Washington D.C., March. [NPR]
WNA, 2003: Global warming. Issue Brief, January 2003, World Nuclear Association, < www.world-nuclear.org/info/inf59.htm > accessed 03/07/07. [NPR]
WNA, 2005a: The global nuclear fuel market: supply and demand 2005-2030. World Nuclear Association report, < www.world-nuclear.org/info/ > accessed 03/07/07. [NPR]
WNA, 2005b: The new economics of nuclear power. World Nuclear Association report, < http://www.world-nuclear.org/reference/pdf/economics.pdf > accessed 03/07/07. [NPR]
WNA, 2006a: World nuclear power reactors 2005-06 and uranium requirements. World Nuclear Association, May 2006, < http://www.world-nuclear.org/info/reactors.htm > accessed 03/07/07. [NPR]
WNA, 2006b: Nuclear power in China. Issue Brief, World Nuclear Association, February 2006: < www.world-nuclear.org/info/inf63.htm > accessed 03/07/07. [NPR]
Woyllinowicz, D., C. Severson-Baker, and M. Raynolds, 2005: Oil sand fever. The Pembina Institute for Appropriate Development, Canada, < www.pembina.org > accessed 03/07/07. [NPR]
WREC, 2006: Proceedings of the 8th World Renewable Energy Congress, August, Firenze. [NPR]
WREA, 2005: Proceedings of World Renewable Energy Assembly, World Council of Renewable Energy, Bonn, November, < www.wrea2005.org > accessed 03/07/07. [NPR]
Yamashita, K. and L. Barreto, 2005: Energyplexes for the 21st Century. Energy, 30, pp. 2453- . Clean
Zhang, X.L., R. Chen, and J.K. He, 2005: Renewable energy development and utilisation in China: opportunities and challenges. International Journal on Global Energy Issues, 24(3/4), pp. 249-258. Clean
| Tag | Explanation | Occurrences | Percentages |
|---|---|---|---|
| JoC |
Journal of Concern A Journal which has published articles by one or more PoCs (Person of Concern) |
13 | 3% |
| MoS |
Model or Simulation Reference appears to be a model or simulation, not observation or experiment. |
50 | 13% |
| NPR |
Non Peer Reviewed Reference has no Journal or no Volume or no Pages or it has Editors. |
580 | 158% |
| SRC |
Self Reference Concern Author of a chapter containing references to own work. |
28 | 7% |
| ARC |
Paper authored or co-authored by person who is also in list of Authors of another chapter. |
23 | 6% |
| 2007 |
Paper dated 2007, when IPCC policy stated cutoff was December 2005 |
2 | 0.5% |
| Clean |
The reference was probably peer reviewed. |
66 | 18% |
NOTE: In the Summary of Reviewer Comments,
Accepted includes only those responses that were unambiguously Accepted.
There are other categories of responses that we have not yet quantified
due to inconsistencies of usage.
| Reviewer | Total Comments | Accepted | IPCC Roles | Papers |
|---|---|---|---|---|
| Government of U.S. Department of State | 215 | 41 | 0 | 0 |
| Harvey, D | 79 | 33 | 1 | 0 |
| Clemmer, Steve | 69 | 4 | 0 | 0 |
| Taylor, MAP | 60 | 11 | 0 | 3 |
| Government of Australia | 53 | 7 | 0 | 1 |
| de Coninck, HC | 52 | 4 | 0 | 3 |
| Sawyer, Steve | 44 | 8 | 0 | 0 |
| Kessels, John | 44 | 14 | 0 | 0 |
| Government of Germany | 42 | 8 | 0 | 0 |
| Government of France | 40 | 13 | 0 | 0 |
| Government of India | 40 | 9 | 0 | 1 |
| Read, P | 34 | 1 | 1 | 2 |
| Dooley, JJ | 32 | 4 | 0 | 7 |
| Gordelier, Stanley | 26 | 7 | 0 | 0 |
| Government of European Community / European Commission | 26 | 3 | 0 | 0 |
| Copley, Christine | 24 | 7 | 0 | 0 |
| Bonduelle, Antoine | 24 | 8 | 0 | 0 |
| Jefferson, M | 23 | 3 | 0 | 2 |
| Abanades, JC | 23 | 4 | 0 | 0 |
| Nicole, Dellero | 20 | 4 | 0 | 0 |
| Guha, Ajay | 20 | 4 | 0 | 0 |
| Treber, Manfred | 20 | 7 | 0 | 0 |
| Somoza, Jose | 19 | 7 | 0 | 0 |
| Caserini, Stefano | 18 | 7 | 0 | 0 |
| Jackson, David | 17 | 7 | 0 | 0 |
| Akimoto, K | 16 | 0 | 0 | 3 |
| Bernstein, L | 16 | 5 | 3 | 0 |
| Teske, S | 16 | 6 | 0 | 1 |
| Lewis, Joanna | 16 | 1 | 0 | 0 |
| Government of Japan | 15 | 0 | 0 | 2 |
| Kjaer, Christian | 15 | 9 | 0 | 0 |
| Athar, GR | 13 | 3 | 0 | 0 |
| Nziramasanga, Norbert | 13 | 3 | 0 | 0 |
| Philibert, C | 13 | 5 | 0 | 12 |
| Gagnon, Luc | 13 | 9 | 0 | 0 |
| Ruijgrok, Walter | 12 | 1 | 0 | 0 |
| Ricketts, Brian | 12 | 0 | 0 | 0 |
| Government of Sweden | 12 | 7 | 0 | 0 |
| Mottershead, Chris | 12 | 4 | 0 | 0 |
| Von Goerne, Gabriela | 11 | 2 | 0 | 0 |
| Hamilton, K | 11 | 3 | 0 | 7 |
| Oshima, Kenichi | 10 | 0 | 0 | 0 |
| Green, C | 10 | 2 | 0 | 2 |
| de Lange, Theo | 9 | 5 | 0 | 0 |
| Macey, Kirsten | 9 | 0 | 0 | 0 |
| Pitz-Paal, Robert | 8 | 4 | 0 | 0 |
| Awerbuch, S | 8 | 1 | 0 | 4 |
| Murayama, S | 7 | 2 | 0 | 1 |
| Lynd, L | 7 | 0 | 0 | 1 |
| Mollersten, K | 7 | 2 | 0 | 2 |
| Cook, I | 7 | 0 | 0 | 1 |
| van Bussel, Gerard | 7 | 4 | 0 | 0 |
| Kuckshinrichs, Wilhelm | 6 | 0 | 0 | 0 |
| Ploger, Friedrich | 6 | 0 | 0 | 0 |
| Latif, M | 6 | 2 | 0 | 1 |
| van Leeuwen, Jan | 6 | 1 | 0 | 0 |
| Bogner, J | 6 | 2 | 2 | 11 |
| Junfeng, Li | 6 | 3 | 0 | 0 |
| Pols, Donald | 6 | 2 | 0 | 0 |
| jacques, Varet | 5 | 1 | 0 | 0 |
| Green, RE | 5 | 2 | 0 | 3 |
| Delhotal, KC | 5 | 1 | 0 | 1 |
| Government of Environment Canada | 5 | 0 | 0 | 0 |
| Yoshida, Satoshi | 5 | 0 | 0 | 0 |
| Aunan, K | 5 | 2 | 0 | 10 |
| Uddin, Noim | 5 | 0 | 0 | 0 |
| Goldston, Robert | 5 | 2 | 0 | 0 |
| IPCC | 5 | 0 | 0 | 50 |
| Gielen, D | 5 | 0 | 1 | 3 |
| Nyboer, J | 5 | 3 | 0 | 5 |
| Government of Spain | 4 | 2 | 0 | 0 |
| Cobb, Jonathan | 4 | 1 | 0 | 0 |
| Fujino, J | 4 | 1 | 0 | 5 |
| Elbersen, Wolter | 4 | 1 | 0 | 0 |
| Grover, RB | 4 | 1 | 0 | 0 |
| Thiam, Nogoye | 4 | 0 | 0 | 0 |
| Government of Finland | 4 | 1 | 0 | 0 |
| Yamba, FD | 4 | 1 | 1 | 4 |
| Omori, Ryota | 3 | 0 | 0 | 0 |
| Finnegan, Pat | 3 | 0 | 0 | 0 |
| Government of Belgium | 3 | 0 | 0 | 0 |
| Gallagher, KS | 3 | 2 | 0 | 3 |
| Caneill, Jean-Yves | 3 | 2 | 0 | 0 |
| Government of China Meteorological Administration | 3 | 0 | 0 | 0 |
| da Silva, Demostenes | 3 | 0 | 0 | 0 |
| Verbruggen, A | 3 | 1 | 1 | 1 |
| Taylor, Peter | 3 | 0 | 0 | 0 |
| Supersberger, Nikolaus | 3 | 1 | 0 | 0 |
| Government of Norwegian Pollution Control Authority | 3 | 0 | 0 | 0 |
| Emerson, Sarah | 2 | 0 | 0 | 0 |
| Romeri, MV | 2 | 0 | 0 | 0 |
| Boyden, James | 2 | 0 | 0 | 0 |
| Kadono, Koji | 2 | 0 | 0 | 0 |
| Blanco, RJ | 2 | 0 | 0 | 0 |
| Campbell, Nick | 2 | 1 | 0 | 0 |
| Schei, TA | 2 | 1 | 0 | 0 |
| Hernandez, Felix | 2 | 0 | 0 | 0 |
| Jones, RJA | 2 | 1 | 0 | 2 |
| Chase, Robert | 2 | 2 | 0 | 0 |
| Nishio, M | 2 | 0 | 0 | 1 |
| pedace, Alberto | 2 | 0 | 0 | 0 |
| Nakakuki, Shinichi | 1 | 0 | 0 | 0 |
| Masui, T | 1 | 0 | 0 | 7 |
| Deutscher, Guy | 1 | 0 | 0 | 0 |
| Koide, Hitoshi | 1 | 0 | 0 | 0 |
| Turk, Eli | 1 | 0 | 0 | 0 |
| Pearce, Catherine | 1 | 0 | 0 | 0 |
| Bosch, P | 1 | 1 | 1 | 0 |
| Government of Korea | 1 | 0 | 0 | 0 |
| Barreto, L | 1 | 0 | 0 | 8 |
| Mori, S | 1 | 0 | 0 | 5 |
| Poot, Brigitte | 1 | 1 | 0 | 0 |
| Beard, Catherine | 1 | 0 | 0 | 0 |
| Schleich, J | 1 | 1 | 0 | 8 |
| Tonooka, Yutaka | 1 | 0 | 0 | 0 |
| Rankin, VB | 1 | 0 | 0 | 0 |
| Martchek, Kenneth | 1 | 1 | 0 | 0 |
| Yanagisawa, Y | 1 | 0 | 0 | 1 |
| Komiyama, R | 1 | 1 | 0 | 2 |
| Totals | 1573 | 348 | 11 | 186 |
| Reviewer Type | Total Comments | Accepted | % Accepted |
|---|---|---|---|
| Govt | 358 | 75 | 20% |
| IPCC | 573 | 119 | 20% |
| Indep | 642 | 154 | 23% |
| Total | 1573 | 348 | 22% |
Main AR4 Index | Working Group WG3 Index | Table of Contents | Authors | Executive Summary | Annotated Text | References | Reviewer Comments