Working Group 3 - Chapter 1: Introduction - (AR4-WG3-1)
Original at: http://www.ipcc.ch/publications_and_data/ar4/wg3/en/ch1.html
Main AR4 Index | Working Group WG3 Index | Table of Contents | Authors | Executive Summary | Annotated Text | References | Reviewer Comments
With the exception of Chapter and Section headings, all coloured text has been inserted by AccessIPCC. The non-coloured text is the IPCC original.
A number of emails from the Climate Research Unit (CRU) of the University of East Anglia were published on the Internet in November 2009. This has provided a window into the world of climate science.
We have identified a number of key individuals involved in the emails whom we have designated as Persons of Concern [PoC]; a Journal in which a PoC has published has been designated as a Journal of Concern [JoC].
This is not to suggest that we believe such papers are necessarily flawed, but rather that, as Joseph Alcamo noted at Bali in October 2009, "as policymakers and the public begin to grasp the multi-billion dollar price tag for mitigating and adapting to climate change, we should expect a sharper questioning of the science behind climate policy".
References occur in a list at the end of each chapter. Citations are within the normal text of sections and paragraphs.
| Tag | Explanation | Where Used | References | Citations |
|---|---|---|---|---|
| PoC |
Person of Concern Key individual involved in CRU emails as defined in this spreadsheet. |
References, Citations, IPCC Roles | 2 | 5 |
| JoC |
Journal of Concern A Journal which has published articles by one or more PoCs (Person of Concern) |
References, Citations | 2 | 2 |
| MoS |
Model or Simulation Reference appears to be a model or simulation, not observation or experiment |
References, Citations | 7 | 10 |
| NPR |
Non Peer Reviewed Reference has no Journal or no Volume or no Pages or it has Editors. |
References, Citations | 43 | 74 |
| SRC |
Self Reference Concern Author of a chapter containing references to own work. |
References, Citations, IPCC Roles | 4 | 9 |
| ARC |
Paper authored or co-authored by person who is also in list of Authors of another chapter. |
References, Citations | 7 | 5 |
| 2007 |
Paper dated 2007, when IPCC policy stated cutoff was December 2005 |
References, Citations | 7 | 30 |
| Ambiguous |
The short inline citation matched with more than one reference; however, AccessIPCC will link to the first reference found. |
Citations | - | - |
| NotFound |
The short inline citation was not matched with any reference. Believed to be caused by typing errors. |
Citations | - | 1 |
| Clean |
The reference was probably peer reviewed. |
References, Citations | 1 | 1 |
Coordinating Lead Authors:
H-Holger Rogner (Germany), Dadi Zhou (China) [SRC:1],
| Concern | Occurrence |
|---|---|
| SRC 1-4 | 1 |
| Potentially Biased Authors | 1 |
| Impartial Authors | 1 |
Lead Authors:
Rick Bradley (USA) [PoC], , Philippe Crabbé (Canada), Ottmar Edenhofer (Germany) [SRC:1], Bill Hare (Australia), Lambert Kuijpers (The Netherlands), Mitsutsune Yamaguchi (Japan),
| Concern | Occurrence |
|---|---|
| PoC | 1 |
| SRC 1-4 | 1 |
| Potentially Biased Authors | 2 |
| Impartial Authors | 4 |
Contributing Authors:
Nicolas Lefevre (France/USA), Jos Olivier (The Netherlands) [SRC:2], Hongwei Yang (China),
| Concern | Occurrence |
|---|---|
| SRC 1-4 | 1 |
| Potentially Biased Authors | 1 |
| Impartial Authors | 2 |
Review Editors:
Hoesung Lee (Republic of Korea), Richard Odingo (Kenya),
| Concern | Occurrence |
|---|---|
| Impartial Authors | 2 |
This chapter should be cited as:
Rogner, H.-H., D. Zhou, R. Bradley. P. Crabbé, O. Edenhofer, B.Hare (Australia), L. Kuijpers, M. Yamaguchi, 2007: Introduction. In Climate Change 2007: Mitigation. Contribution of Working Group III to the Fourth Assessment Report of the Intergovernmental Panel on Climate Change [B. Metz, O.R. Davidson, P.R. Bosch, R. Dave, L.A. Meyer (eds)], Cambridge University Press, Cambridge, United Kingdom and New York, NY, USA.
EXECUTIVE SUMMARY
The ultimate objective of the United Nations Framework Convention on Climate Change (UNFCCC) is to achieve the stabilization of greenhouse gas (GHG) concentrations in the atmosphere at a level that would prevent dangerous anthropogenic interference with the climate system. Such a level should be achieved within a time frame sufficient to allow ecosystems to adapt naturally to climate change, to ensure that food production is not threatened and to enable economic development to proceed in a sustainable manner (Article 2).
This Chapter discusses Article 2 of the Convention within the framework of the main options and conditions under which it is to be implemented, reflects on past and future GHG emission trends, highlights the institutional mechanisms currently in place for the implementation of climate change and sustainable development objectives, summarizes changes from previous assessments and provides a brief roadmap for the ‘Climate Change 2007 : Mitigation of Climate Change’ assessment.
Defining what is dangerous anthropogenic interference with the climate system and, consequently, the limits to be set for policy purposes are complex tasks that can only be partially based on science, as such definitions inherently involve normative judegments. Decisions made in relation to Article 2 will determine the level of GHG concentrations in the atmosphere (or the corresponding climate change) that is set as the goal for policy and have fundamental implications for emission reduction pathways as well as the scale of adaptation required. The choice of a stabilization level implies the balancing of the risks of climate change (risks of gradual change and of extreme events, risk of irreversible change of the climate, including risks for food security, ecosystems and sustainable development) against the risk of response measures that may threaten economic sustainability. There is little consensus as to what constitutes anthropogenic interference with the climate system and, thereby, on how to operationalize Article 2 (high agreement, much evidence).
Although any definition of ‘dangerous interference’ is by necessity based on its social and political ramifications and, as such, depends on the level of risk deemed acceptable, deep emission reductions are unavoidable in order to achieve stabilization. The lower the stabilization level, the earlier these deep reductions have to be realized (high agreement, much evidence).
At the present time total annual emissions of GHGs are rising. Over the last three decades, GHG emissions have increased by an average of 1.6% per year [1] with carbon dioxide (CO2) emissions from the use of fossil fuels growing at a rate of 1.9% per year. In the absence of additional policy actions, these emission trends are expected to continue. It is projected that – with current policy settings – global energy demand and associated supply patterns based on fossil fuels – the main drivers of GHG emissions – will continue to grow. Atmospheric CO2 concentrations have increased by almost 100 ppm in comparison to its preindustrial level, reaching 379 ppm in 2005, with mean annual growth rates in the 2000 – 2005 period that were higher than those in the 1990 s. The total CO2 equivalent (CO2-eq) concentration of all long-lived GHGs is currently estimated to be about 455 ppm CO2-eq, although the effect of aerosols, other air pollutants and land-use change reduces the net effect to levels ranging from 311 to 435 ppm CO2-eq (high agreement, much evidence).
Despite continuous improvements in energy intensities, global energy use and supply are projected to continue to grow, especially as developing countries pursue industrialization. Should there be no substantial change in energy policies, the energy mix supplied to run the global economy in the 2025 – 2030 time frame will essentially remain unchanged – more than 80% of the energy supply will be based on fossil fuels, with consequent implications for GHG emissions. On this basis, the projected emissions of energy-related CO2 in 2030 are 40–110 % higher than in 2000 (with two thirds to three quarters of this increase originating in non-Annex I countries), although per capita emissions in developed countries will remain substantially higher. For 2030, GHG emission projections (Kyoto gases) consistently show a 25–90% increase compared to 2000, with more recent projections being higher than earlier ones (high agreement, much evidence).
The numerous mitigation measures that have been undertaken by many Parties to the UNFCCC and the entry into force of the Kyoto Protocol in February 2005 (all of which are steps towards the implementation of Article 2) are inadequate for reversing overall GHG emission trends. The experience within the European Union (EU) has demonstrated that while climate policies can be – and are being – effective, they are often difficult to fully implement and coordinate, and require continual improvement in order to achieve objectives. In overall terms, however, the impacts of population growth, economic development, patterns of technological investment and consumption continue to eclipse the improvement in energy intensities and decarbonization. Regional differentiation is important when addressing climate change mitigation – economic development needs, resource endowments and mitigative and adaptive capacities – are too diverse across regions for a ‘one-size fits all’ approach (high agreement, much evidence).
Properly designed climate change policies can be part and parcel of sustainable development, and the two can be mutually reinforcing. Sustainable development paths can reduce GHG emissions and reduce vulnerability to climate change. Projected climate changes can exacerbate poverty and undermine sustainable development, especially in least-developed countries. Hence, global mitigation efforts can enhance sustainable development prospects in part by reducing the risk of adverse impacts of climate change. Mitigation can also provide co-benefits, such as improved health outcomes. Mainstreaming climate change mitigation is thus an integral part of sustainable development (medium agreement, much evidence).
This chapter concludes with a road map of this report. Although the structure of this report (Fourth Assessment Report (AR4)) resembles the Third Assessment Report (TAR), there are distinct differences. The AR4 assigns greater weight to (1) a more detailed resolution of sectoral mitigation options and costs, (2) regional differentiation, (3) emphasizing cross-cutting issues (e.g. risks and uncertainties, decision and policy making, costs and potentials, biomass, the relationships between mitigation, adaptation and sustainable development, air pollution and climate, regional aspects and issues related to the implementation of UNFCCC Article 2), and (4) the integration of all these aspects.
1.1 Introduction
The assessment ‘Climate Change 2007 : Mitigation of Climate Change’ is designed to provide authoritative, timely information on all aspects of technologies and socio-economic policies, including cost-effective measures to control greenhouse gas (GHG) emissions. A thorough understanding of future GHG emissions and their drivers, available mitigation options, mitigation potentials and associated costs and ancillary benefits is especially important to support negotiations on future reductions in global emissions.
This chapter starts with a discussion of the key issues involved in Article 2 of the United Nations Framework Convention on Climate Change (UNFCCC) and of the relationship of these to emission pathways and broad mitigation options. The sections that follow reflect on past and future GHG emission trends, highlight the institutional mechanisms in place for the implementation of climate change and sustainable development objectives, summarize changes from previous assessments and provides a concise roadmap to the ‘Climate Change 2007 : Mitigation of Climate Change’ assessment.
1.2 Ultimate objective of the UNFCCC
The UNFCCC was adopted in May 1992 in New York and opened for signature at the ‘Rio Earth Summit’ in Rio de Janeiro a month later. It entered into force in March 1994 and has achieved near universal ratification with ratification by 189 countries of the 194 UN member states (December 2006 ) [2] .
1.2.1 Article 2 of the Convention
Article 2 of the UNFCCC specifies the ultimate objective of the Convention and states:
‘The ultimate objective of this Convention and any related legal instruments that the Conference of the Parties may adopt is to achieve, in accordance with the relevant provisions of the Convention, stabilization of greenhouse gas concentrations in the atmosphere at a level that would prevent dangerous anthropogenic interference with the climate system. Such a level should be achieved within a time frame sufficient to allow ecosystems to adapt naturally to climate change, to ensure that food production is not threatened and to enable economic development to proceed in a sustainable manner’ ( UN, 1992 [NPR] ).
The criterion that relates to enabling economic development to proceed in a sustainable manner is a double-edged sword. Projected anthropogenic climate change appears likely to adversely affect sustainable development, with adverse effects tending to increase with higher levels of climate change and GHG concentrations ( IPCC, 2007b [NPR, 2007] , SPM and Chapter 19). Conversely, costly mitigation measures could have adverse effects on economic development. This dilemma facing policymakers results in (a varying degree of) tension that is manifested in the debate over the scale of the interventions and the balance to be adopted between climate policy (mitigation and adaptation) and economic development.
The assessment of impacts, vulnerability and adaptation potentials is likely to be important for determinating the levels and rates of climate change which would result in ecosystems, food production or economic development being threatened to a level sufficient to be defined as dangerous. Vulnerabilities to anthropogenic climate change are strongly regionally differentiated, with often those in the weakest economic and political position being the most susceptible to damages ( IPCC, 2007b [NPR, 2007] , Chapter 19, Tables 19.1 and 19.3.3).
Limits to climate change or other changes to the climate system that are deemed necessary to prevent dangerous anthropogenic interference with the climate system can be defined in terms of various – and often quite different – criteria, such as concentration stabilization at a certain level, global mean temperature or sea level rise or levels of ocean acidification. Whichever limit is chosen, its implementation would require the development of consistent emission pathways and levels of mitigation ( Chapter 3 ).
1.2.2 What is dangerous interference with the climate system?
Defining what is dangerous interference with the climate system is a complex task that can only be partially supported by science, as it inherently involves normative judgements. There are different approaches to defining danger, and an interpretation of Article 2 is likely to rely on scientific, ethical, cultural, political and/or legal judgements. As such, the agreement(s) reached among the Parties in terms of what may constitute unacceptable impacts on the climate system, food production, ecosystems or sustainable economic development will represent a synthesis of these different perspectives.
Over the past two decades several expert groups have sought to define levels of climate change that could be tolerable or intolerable, or which could be characterized by different levels of risk. In the late 1980 s, the World Meteorological Organization (WMO)/International Council of Scientific Unions (ICSU)/UN Environment Programme (UNEP) Advisory Group on Greenhouse Gases (AGGG) identified two main temperature indicators or thresholds with different levels of risk ( Rijsberman and Swart, 1990 [NPR, ARC] ). Based on the available knowledge at the time a 2ºC increase was determined to be ‘an upper limit beyond which the risks of grave damage to ecosystems, and of non-linear responses, are expected to increase rapidly’. This early work also identified the rate of change to be of importance to determining the level of risk, a conclusion that has subsequently been confirmed qualitatively ( IPCC, 2007b [NPR, 2007] , Chapters 4 and 19). More recently, others in the scientific community have reached conclusions that point in a similar direction ‘that global warming of more than 1°C, relative to 2000, will constitute “dangerous” climate change as judged from likely effects on sea level and extermination of species’ ( Hansen et al., 2006 [NPR] ). Probabilistic assessments have also been made that demonstrate how scientific uncertainties, different normative judgments on acceptable risks to different systems ( Mastrandrea and Schneider, 2004 [PoC, JoC, ARC] ) and/or interference with the climate system ( Harvey, 2007 [2007] ) affect the levels of change or interference set as goals for policy ( IPCC, 2007b [NPR, 2007] , Chapter 19). From an economic perspective, the Stern Review ( Stern, 2006 [NPR] ) found that in order to minimise the most harmful consequences of climate change, concentrations would need to be stabilized below 550 ppm CO2-eq. The Review further argues that any delay in reducing emissions would be ‘would be costly and dangerous’. This latter conclusion is at variance with the conclusions drawn from earlier economic analyses which support a slow ‘ramp up’ of climate policy action ( Nordhaus, 2006 [NPR] ) and, it has been argued, is a consequence of the approach taken by the Stern Review to intergenerational equity ( Dasgupta, 2006 [NPR] ).
The IPCC Third Assessment Report (TAR) identified five broad categories of reasons for concern that are relevant to Article 2: (1) Risks to unique and threatened systems, (2) risks from extreme climatic events, (3) regional distribution of impacts, (4) aggregate impacts and (5) risks from large-scale discontinuities. The Fourth Assessment Report (AR4) focuses on Key Vulnerabilities relevant to Article 2, which are broadly categorized into biological systems, social systems, geophysical systems, extreme events and regional systems ( IPCC, 2007b [NPR, 2007] , Chapter 19). The implications of different interpretations of dangerous anthropogenic interference for future emission pathways are reviewed in IPCC 2007b [NPR, 2007] ), Chapter 9 and also in Chapter 3 of this report. The literature confirms that climate policy can substantially reduce the risk of crossing thresholds deemed dangerous ( IPCC, 2007b [NPR, 2007] , SPM and Chapter 19; Chapter 3 , Section 3.5.2 of this report).
While the works cited above are principally scientific (expert-led) assessments, there is also an example of governments seeking to define acceptable levels of climate change based on interpretations of scientific findings. In 2005, the EU Council (25 Heads of Government of the European Union) agreed that – with a view to achieving the ultimate objective of the Convention – the global annual mean surface temperature increase should not exceed 2ºC above pre-industrial levels ( CEU, 2005 [NPR] ).
1.2.3 Issues related to the implementation of Article 2
Decisions made in relation to Article 2 will determine the level of climate change that is set as the goal for policy and have fundamental implications for emission reduction pathways, the feasibility, timing and scale of adaptation required and the magnitude of unavoidable losses. The emission pathways which correspond to different GHG or radiative forcing stabilization levels and consequential global warming are reviewed in Chapter 3 (see Tables 3.9 and 3.10 ). The potential consequences of two hypothetical limits can provide an indication of the differing scales of mitigation action that depend on Article 2 decisions: A 2ºC above pre-industrial limit on global warming would implies that emissions peak within the next decade and be reduced to less than 50% of the current level by 2050 [3] ; a 4ºC limit would imply that emissions may not have to peak until well after the middle of the century and could still be well above 2000 levels in 2100 . In relation to the first hypothetical limt, the latter would have higher levels of adaptation costs and unavoidable losses, but carry lower mitigation costs.
Issues related to the mitigation, adaptation and sustainable development aspects of the implementation of Article 2 thus include, among others, the linkages between sustainable development and the adverse effects climate change, the need for equity and cooperation and the recognition of common but differentiated responsibilities and respective capabilities as well as the precautionary principle (see Section 1.4.1 for more detail on relevant UNFCCC Articles that frame these issues). In this context, risk management issues which take into account several key aspects of the climate change problem, such as inertia, irreversibility, the risk of abrupt or catastrophic changes and uncertainty, are introduced in this section and discussed in more detail in Chapters 2 , 3 and 11 .
1.2.3.1 Sustainable development
Sustainable development has environmental, economic and social dimensions (see Chapter 2 , Section 2.1 ). Properly designed climate change responses can be part and parcel of sustainable development, and the two can be mutually reinforcing ( Section 2.1 ). Mitigation, by limiting climate change, can conserve or enhance natural capital (ecosystems, the environment as sources and sinks for economic activities) and prevent or avoid damage to human systems and, thereby, contribute to the overall productivity of capital needed for socio-economic development, including mitigative and adaptive capacity. In turn, sustainable development paths can reduce vulnerability to climate change and reduce GHG emissions. The projected climate changes can exacerbate poverty and thereby undermine sustainable development (see, for example, IPCC, 2007b [NPR, 2007] , Chapters 6, Section 9.7 and 20.8.3), especially in developing countries, which are the most dependent on natural capital and lack financial resources (see Chapter 2 and Stern 2006 [NPR] )). Hence global mitigation efforts can enhance sustainable development prospects in part by reducing the risk of adverse impacts of climate change (see also Chapter 12 ).
The stabilization of GHG concentrations and, in particular, of the main greenhouse gas, CO2, requires substantial emission reductions, well beyond those built into existing agreements such as the Kyoto Protocol. The timing and rate of these reductions depend on the level of the climate goal chosen (see Chapter 3.3.5.1 ).
1.2.3.2 Adaptation and mitigation
Adaptation and mitigation can be complementary, substitutable or independent of each other (see IPCC, 2007b [NPR, 2007] , Chapter 18). If complementary, adaptation reduces the costs of climate change impacts and thus reduces the benefits of mitigation. Although adaptation and mitigation may be substitutable up to a certain point, they are never perfect substitutes for each other since mitigation will always be required to avoid ‘dangerous’ and irreversible changes to the climate system. Irrespective of the scale of the mitigation measures that are implemented in the next 10–20 years, adaptation measures will still be required due to the inertia in the climate system. As reported in IPCC, 2007b [NPR, 2007] , Chapter 19 (and also noted in Stern 2006 [NPR] )), changes in the climate are already causing setbacks to economic and social development in some developing countries with temperature increases of less than 1°C. Unabated climate change would increase the risks and costs very substantially ( IPCC, 2007b [NPR, 2007] , Chapter 19). Both adaptation and mitigation depend on capital assets, including social capital, and both affect capital vulnerability and GHG emissions (see Chapter 2 , Section 2.5.2 ). Through this mutual dependence, both are tied to sustainable development (see Sections 2.5 , 11.8 and 11.9 , 12.2 and 12.3 ).
1.2.3.3 Inertia
Inertia in both the climate and socio-economic systems would need to be taken into account when mitigation actions are being considered. Mitigation actions aimed at specific climate goals would need to factor in the response times of the climate system, including those of the carbon cycle, atmosphere and oceans. A large part of the atmospheric response to radiative forcing occurs on decadal time scales, but a substantial component is linked to the century time scales of the oceanic response to the same forcing changes ( Meehl et al., 2007 [NPR, MoS, 2007] ). Once GHG concentrations are stabilized global mean temperature would very likely stabilize within a few decades, although a further slight increase may still occur over several centuries ( Meehl et al., 2007 [NPR, MoS, 2007] ). The rise in sea level, however, would continue for many centuries after GHG stabilization due to both ongoing heat uptake by the oceans and the long time scale of ice sheet response to warming ( Meehl et al., 2007 [NPR, MoS, 2007] ). The time scales for mitigation are linked to technological, social, economic, demographic and political factors. Inertia is a characteristic of the energy system with its long-life infrastructures, and this inertia is highly relevant to how fast GHG concentrations can be stabilized (Chapter 11.6.5 ). Adaptation measures similarly exhibit a range of time scales, and there can be substantial lead times required before measures can be implemented and subsequently take effect, particularly when it involves infrastructure ( IPCC, 2007b [NPR, 2007] , Chapter 17).
The consequence of inertia in both the climate and socio-economic systems is that benefits from mitigation actions initiated now – in the short term – would lead to significant changes in the climate being avoided several decades further on. This means that mitigation actions need to be implemented in the short term in order to have medium- and long-term benefits and to avoid the lock in of carbon intensive technologies (Chapter 11.6.5 ).
1.2.3.4 Uncertainty and risk
Uncertainty in knowledge is an important aspect in the implementation of Article 2, whether it is assessing future GHG emissions or the severity of climate change impacts and regional changes, evaluating these impacts over many generations, estimating mitigation costs or evaluating the level of mitigation action needed to reduce risk. Notwithstanding these uncertainties, mitigation will reduce the risk of both global mean and regional changes and the risk of abrupt changes in the climate system (see Chapter 2 , Section 2.3 ).
There may be risks associated with rapid and/or abrupt changes in the climate and the climate system as a result of human interference ( Solomon et al., 2007 [NPR, PoC, 2007] ; IPCC, 2007b [NPR, 2007] , Chapter 19 Tables 19.1 and 19.3.5-7). These include changes in climate variability (El Nino Southern Oscillation, monsoons); a high likelihood that warming will lead to an increase in the risk of many extreme events, including floods, droughts, heat waves and fires, with increasing levels of adverse impacts; a risk that a 1–2ºC sustained global warming (versus the temperature at present) would lead to a commitment to a large sea-level rise due to at least the partial deglaciation of both ice sheets; an uncertain risk of a shutdown of the North Atlantic Meridional Overturning Circulation; a large increase in the intensity of tropical cyclones with increasing levels of adverse impacts as temperatures increase; the risk that positive feedbacks from warming may cause the release of CO2 or methane (CH4) from the terrestrial biosphere and soils ( IPCC, 2007b [NPR, 2007] , Chapter 19 Tables 19.1 and 19.3.5-7). In the latter case, a positive climate–carbon cycle feedback would reduce the land and ocean uptake of CO2, implying a reduction of the allowable emissions required to achieve a given atmospheric CO2 stabilization level ( Meehl et al., 2007 [NPR, MoS, 2007] , Executive Summary).
1.2.3.5 Irreversibility
Irreversibility is an important aspect of the climate change issue, with implications for mitigation and adaptation responses. The response of the climate system to anthropogenic forcing is likely to be irreversible over human time scales, and much of the damage is likely to be irreversible even over longer time scales. Mitigation and adaptation will often require investments involving sunk (irreversible) costs in new technologies and practices (Sections 2.2.3 , 11.6.5 IPCC, 2007b [NPR, 2007] , Chapter 17). Decision-makers will need to take into account these environmental, socio-economic and technological irreversibilities in deciding on the timing and scale of mitigation action.
The incentive to evade mitigation costs increases with the degree of substitutability among individual mitigation efforts (mitigation is largely additive) and with the inequality of the distribution of net benefits among regime participants. However, individual mitigation costs decrease with efficient mitigation actions undertaken by others. Because mitigation efforts are additive, the larger the number of participants, the smaller the individual cost of providing the public good – in this case, climate system stabilization. Cooperation requires the sharing of both information on climate change and technologies through technology transfers as well as the coordination of national actions lest the efforts required by the climate regime be underprovided.
1.2.3.6 Public good
The climate system tends to be overused (excessive GHG concentrations) because of its natural availability as a resource whose access is open to all free of charge. In contrast, climate protection tends to be underprovided. In general, the benefits of avoided climate change are spatially indivisible, freely available to all (non-excludability), irrespective of whether one is contributing to the regime costs or not. As regime benefits by one individual (nation) do not diminish their availability to others (non-rivalry), it is difficult to enforce binding commitments on the use of the climate system [4] ( Kaul et al., 1999 [NPR] ; 2003 ). This may result in ‘free riding’, a situation in which mitigation costs are borne by some individuals (nations) while others (the ‘free riders’) succeed in evading them but still enjoy the benefits of the mitigation commitments of the former.
1.3 Energy, emissions and trends in Research and Development – are we on track?
1.3.1 Review of the last three decades
Since pre-industrial times, increasing emissions of GHGs due to human activities have led to a marked increase in atmospheric concentrations of the long-lived GHG gases carbon dioxide (CO2), CH4, and nitrous oxide (N2O), perfluorocarbons PFCs, hydrofluorocarbons (HFCs) and sulphur hexafluoride (SF6) and ozone-depleting substances (ODS; chlorofluorocarbons (CFCs), hydrochlorofluorocarbons (HCFCs), halons) and the human-induced radiative forcing of the Earth’s climate is largely due to the increases in these concentrations. The predominant sources of the increase in GHGs are from the combustion of fossil fuels. Atmospheric CO2 concentrations have increased by almost 100 ppm in comparison to its preindustrial levels, reaching 379 ppm in 2005, with mean annual growth rates in the 2000 – 2005 period that were higher than those in the 1990 s.
The direct effect of all the long-lived GHGs is substantial, with the total CO2 equivalent concentration of these gases currently being estimated to be around 455 ppm CO2-eq [5] (range: 433–477 ppm CO2-eq). The effects of aerosol and land-use changes reduce radiative forcing so that the net forcing of human activities is in the range of 311 to 435 ppm CO2-eq, with a central estimate of about 375 ppm CO2-eq.
A variety of sources exist for determining global and regional GHG and other climate forcing agent trends. Each source has its strengths and weaknesses and uncertainties. The EDGAR database ( Olivier et al., 2005 [SRC] , 2006 ) contains global GHG emission trends categorized by broad sectors for the period 1970 – 2004, and Marland et al. 2006 [NPR] ) report CO2 emissions on a global basis. Both databases show a similar temporal evolution of emissions. Since 1970, the global warming potential (GWP)-weighted emissions of GHGs (not including ODS which are controlled under the Montreal Protocol), have increased by approximately 70%, (24% since 1990 ), with CO2 being the largest source, having grown by approximately 80% (28% since 1990 ) to represent 77% of total anthropogenic emissions in 2004 (74% in 1990 ) ( Figure 1.1 ). Radiative forcing as a result of increases in atmospheric CO2 concentrations caused by human activities since the preindustrial era predominates over all other radiative forcing agents ( IPCC, 2007a [NPR, 2007] , SPM). Total CH4 emissions have risen by about 40% from 1970 (11% from 1990 ), and on a sectoral basis there has been an 84% (12% from 1990 ) increase from combustion and the use of fossil fuels, while agricultural emissions have remained roughly stable due to compensating falls and increases in rice and livestock production, respectively. N2O emissions have grown by 50% since 1970 (11% since 1990 ), mainly due to the increased use of fertilizer and the aggregate growth of agriculture. Industrial process emissions of N2O have fallen during this period.
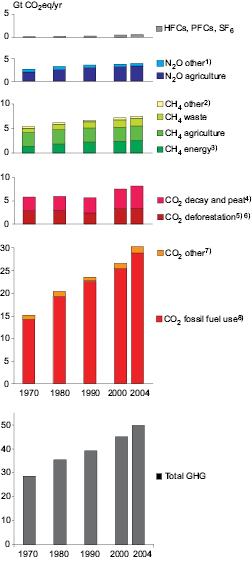
Figure 1.1a Global anthropogenic greenhouse gas trends, 1970 – 2004 .
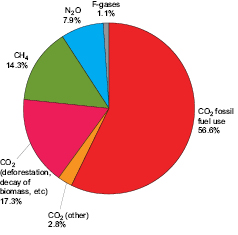
Figure 1.1b Global anthropogenic greenhouse gas emissions in 2004 .
The use and emissions of all fluorinated gases (including those controlled under the Montreal Protocol) decreased substantially during 1990 – 2004 . The emissions, concentrations and radiative forcing of one type of fluorinated gas, the HFCs, grew rapidly during this period as these replaced ODS; in 2004, CFCs were estimated to constitute about 1.1% of the total GHG emissions (100-year GWP) basis. Current annual emissions of all fluorinated gases are estimated at 2.5 GtCO2-eq, with HFCs at 0.4 GtCO2-eq. The stocks of these gases are much larger and currently represent about 21 GtCO2-eq.
The largest growth in CO2 emissions has come from the power generation and road transport sectors, with the industry, households and the service sector [6] remaining at approximately the same levels between 1970 and 2004 ( Figure 1.2 ). By 2004, CO2 emissions from power generation represented over 27% of the total anthropogenic CO2 emissions and the power sector was by far its most important source. Following the sectoral breakdown adopted in this report (Chapters 4 – 10 ), in 2004 about 26% of GHG emissions were derived from energy supply (electricity and heat generation), about 19% from industry, 14% from agriculture [7] , 17% from land use and land-use change [8] , 13% from transport, 8% from the residential, commercial and service sectors and 3% from waste (see Figure 1.3 ). These values should be regarded as indicative only as some uncertainty remains, particularly with regards to CH4 and N2O emissions, for which the error margin is estimated to be in the order of 30–50%, and CO2 emissions from agriculture, which have an even larger error margin.
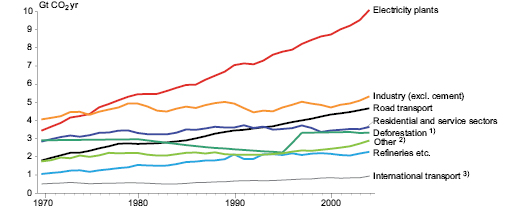
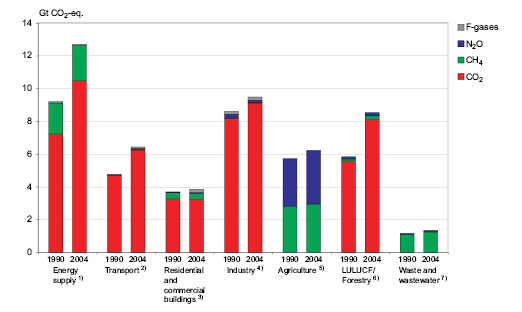
Figure 1.3a: GHG emissions by sector in 1990 and 2004 .
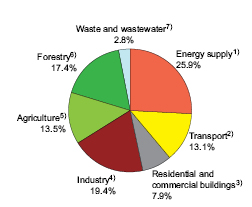
Figure 1.3b: GHG emissions by sector in 2004 .
Since 1970, GHG emissions from the energy supply sector have grown by over 145%, while those from the transport sector have grown by over 120%; as such, these two sectors show the largest growth in GHG emissions. The industry sector’s emissions have grown by close to 65%, LULUCF (land use, land-use change and forestry) by 40% while the agriculture sector (27%) and residential/commercial sector (26%) have experienced the slowest growth between 1970 and 2004 .
The land-use change and forestry sector plays a significant role in the overall carbon balance of the atmosphere. However, data in this area are more uncertain than those for other sectors. The Edgar database indicates that, in 2004, the share of CO2 emissions from deforestation and the loss of carbon from soil decay after logging constituted approximately 7–16% of the total GHG emissions (not including ODS) and between 11 and 28% of fossil CO2 emissions. Estimates vary considerably. There are large emissions from deforestation and other land-use change activities in the tropics; these have been estimated in IPCC 2007a [NPR, 2007] ) for the 1990 s to have been 5.9 GtCO2-eq, with a large uncertainty range of 1.8–9.9 GtCO2-eq ( Denman et al., 2007 [NPR, ARC, 2007] ). This is about 25% (range: 8–42%) of all fossil fuel and cement emissions during the 1990 s. The underlying factors accounting for the large range in the estimates of tropical deforestation and land-use changes emissions are complex and not fully resolved at this time ( Ramankutty et al., 2006 [NPR, MoS] ). For the Annex I Parties that have reported LULUCF sector data to the UNFCCC (including agricultural soils and forests) since 1990, the aggregate net sink reported for emissions and removals over the period up to 2004 average out to approximately 1.3 GtCO2-eq (range: –1.5 to –0.9 GtCO2-eq) [9] .
On a geographic basis, there are important differences between regions. North America, Asia and the Middle East have driven the rise in emissions since 1972 . The former countries of the Soviet Union have shown significant reductions in CO2 emissions since 1990, reaching a level slightly lower than that in 1972 . Developed countries (UNFCCC Annex I countries) hold a 20% share in the world population but account for 46.4% of global GHG emissions. In contrast, the 80% of the world population living in developing countries (non-Annex I countries) account for 53.6% of GHG emissions (see Figure 1.4 a). Based on the metric of GHG emission per unit of economic output (GHG/GDPppp) [10] , Annex I countries generally display lower GHG intensities per unit of economic production process than non-Annex I countries (see Figure 1.4 b).
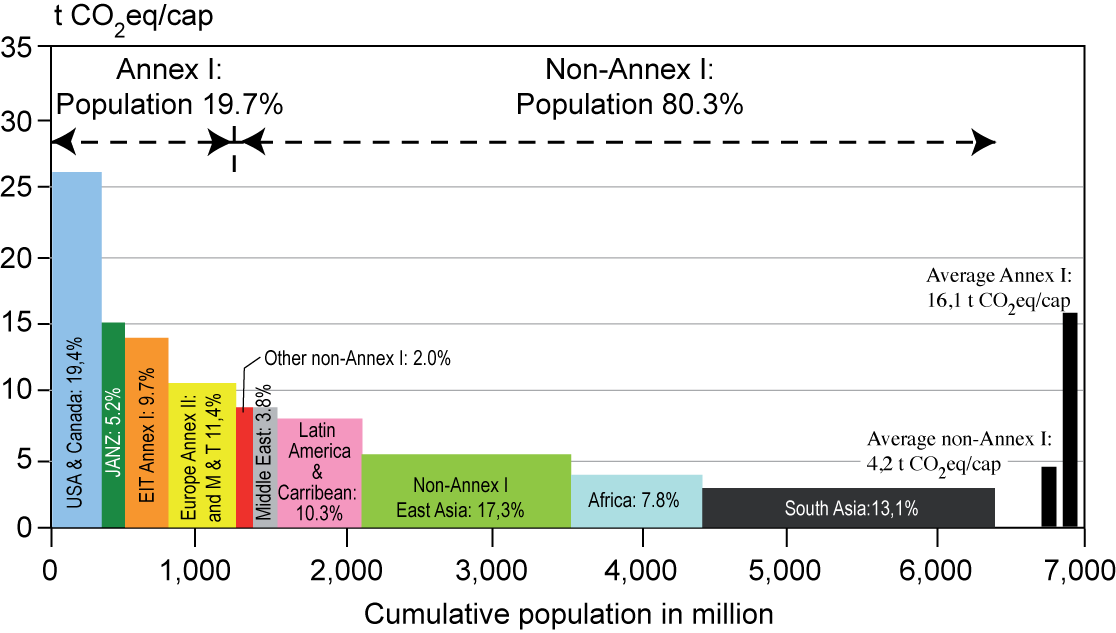
Figure 1.4a: Distribution of regional per capita GHG emissions (all Kyoto gases including those from land-use) over the population of different country groupings in 2004. The percentages in the bars indicate a region’s share in global GHG emissions.
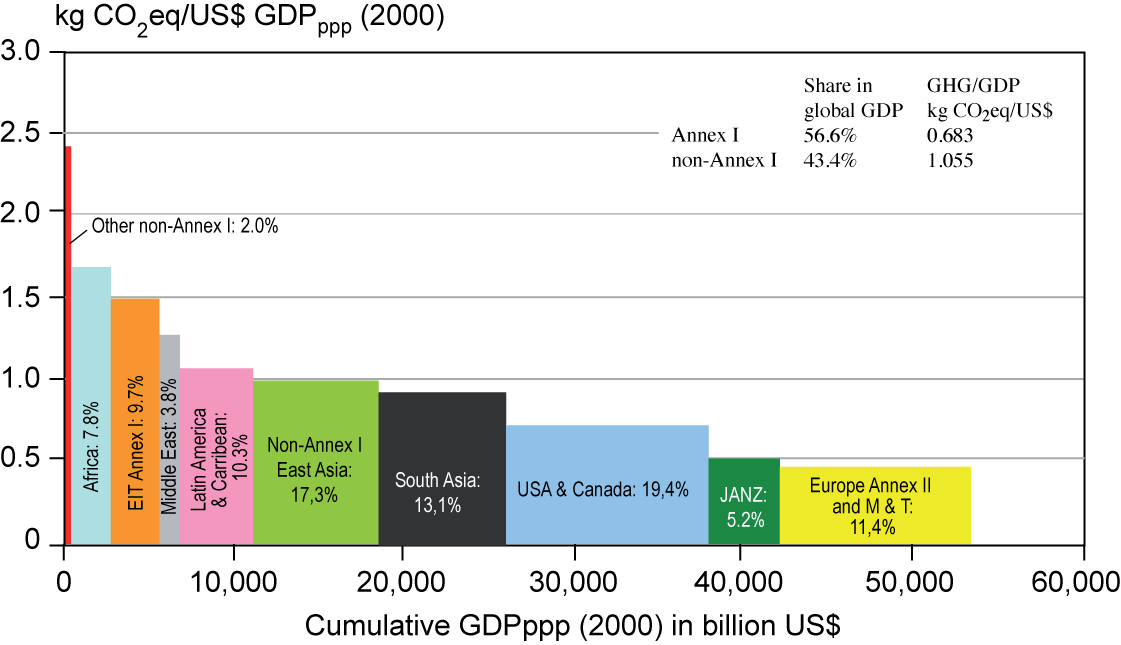
Figure 1.4b: Distribution of regional GHG emissions (all Kyoto gases including those from land-use) per USD of GDPppp over the GDP of different country groupings in 2004. The percentages in the bars indicate a region’s share in global GHG emissions.
- EIT Annex I: Belarus, Bulgaria, Croatia, Czech Republic, Estonia, Hungary, Latvia, Lithuania, Poland, Romania, Russian Federation, Slovakia, Slovenia, Ukraine
- Europe Annex II & M&T: Austria, Belgium, Denmark, Finland, France, Germany, Greece, Iceland, Ireland, Italy, Liechtenstein, Luxembourg, Netherlands, Norway, Portugal, Spain, Sweden, Switzerland, United Kingdom; Monaco and Turkey
- JANZ: Japan, Australia, New Zealand.
- Middle East: Bahrain, Islamic Republic of Iran, Israel, Jordan, Kuwait, Lebanon, Oman, Qatar, Saudi Arabia, Syria, United Arab Emirates, Yemen
- Latin America & the Caribbean: Antigua & Barbuda, Argentina, Bahamas, Barbados, Belize, Bolivia, Brazil, Chile, Colombia, Costa Rica, Cuba, Dominica, Dominican Republic, Ecuador, El Salvador, Grenada, Guatemala, Guyana, Haiti, Honduras, Jamaica, Mexico, Nicaragua, Panama, Paraguay, Peru, Saint Lucia, St. Kitts-Nevis-Anguilla, St. Vincent-Grenadines, Suriname, Trinidad and Tobago, Uruguay, Venezuela
- Non-Annex I East Asia: Cambodia, China, Korea (DPR), Laos (PDR), Mongolia, Republic of Korea, Viet Nam.
- South Asia: Afghanistan, Bangladesh, Bhutan, Comoros, Cook Islands, Fiji, India, Indonesia, Kiribati, Malaysia, Maldives, Marshall Islands, Micronesia, (Federated States of), Myanmar, Nauru, Niue, Nepal, Pakistan, Palau, Papua New Guinea, Philippine, Samoa, Singapore, Solomon Islands, Sri Lanka, Thailand, Timor-Leste, Tonga, Tuvalu, Vanuatu
- North America: Canada, United States of America.
- Other non-Annex I: Albania, Armenia, Azerbaijan, Bosnia Herzegovina, Cyprus, Georgia, Kazakhstan, Kyrgyzstan, Malta, Moldova, San Marino, Serbia, Tajikistan, Turkmenistan, Uzbekistan, Republic of Macedonia
- Africa: Algeria, Angola, Benin, Botswana, Burkina Faso, Burundi, Cameroon, Cape Verde, Central African Republic, Chad, Congo, Democratic Republic of Congo, Côte d’Ivoire, Djibouti, Egypt, Equatorial Guinea, Eritrea, Ethiopia, Gabon, Gambia, Ghana, Guinea, Guinea-Bissau, Kenya, Lesotho, Liberia, Libya, Madagascar, Malawi, Mali, Mauritania, Mauritius, Morocco, Mozambique, Namibia, Niger, Nigeria, Rwanda, Sao Tome and Principe, Senegal, Seychelles, Sierra Leone, South Africa, Sudan, Swaziland, Togo, Tunisia, Uganda, United Republic of Tanzania, Zambia, Zimbabwe
The promotion of energy efficiency improvements and fuel switching are among the most frequently applied policy measures that result in mitigation of GHG emissions. Although they may not necessarily be targeted at GHG emission mitigation, such policy measures do have a strong impact in lowering the emission level from where it would be otherwise.
According to an analysis of GHG mitigation activities in selected developing countries by Chandler et al. 2002 [NPR, SRC] ), the substitution of gasoline-fuelled cars with ethanol-fuelled cars and that of conventional CHP (combined heat and power; also cogeneration) plants with sugar-cane bagasse CHP plants in Brazil resulted in an estimated carbon emission abatement of 23.5 MtCO2 in 2000 (actual emissions in 2000 : 334 MtCO2). According to the same study, economic and energy reforms in China curbed the use of low-grade coal, resulting in avoided emissions of some 366 MtCO2 (actual emissions: 3,100 MtCO2). In India, energy policy initiatives including demand-side efficiency improvements are estimated to have reduced emissions by 66 MtCO2 (compared with the actual emission level of 1,060 MtCO2). In Mexico, the switch to natural gas, the promotion of efficiency improvements and lower deforestation are estimated to have resulted in 37 MtCO2 of emission reductions, compared with actual emissions of 685 MtCO2.
For the EU-25 countries, the European Environment Agency ( EEA, 2006 [NPR] ) provides a rough estimate of the avoided CO2 emissions from public electricity and heat generation due to efficiency improvements and fuel switching. If the efficiency and fuel mix had remained at their 1990 values, emissions in 2003 would have been some 34% above actual emissions, however linking these reductions to specific policies was found to be difficult. For the UK and Germany about 60% of the reductions from 1990 to 2000 were found to be due to factors other than the effects of climate-related policies ( Eichhammer et al., 2001 [NPR, ARC] , 2002 ).
Since 2000, however, many more policies have been put into place, including those falling under the European Climate Change Programme (ECCP), and significant progress has been made, including the establishment of the EU Emissions Trading Scheme (EU ETS) ( CEC, 2006 [NPR] ). A review of the effectiveness of the first stage of the ECCP reported that about one third of the potential reductions had been fully implemented by mid 2006 [11] . Overall EU-25 emissions in 2004 were 0.9% lower than in the base year, and the European Commission (EC) assessed the EC Kyoto target (8% reduction relative to the base year) to be within reach under the conditions that (1) all additional measures currently under discussion are put into force in time, (2) Kyoto mechanisms are used to the full extent planned and (3) removals from Articles 3.3 and 3.4 activities (carbon sinks) contribute to the extent projected ( CEC, 2006 [NPR] ). Overall this shows that climate policies can be effective, but that they are difficult to fully implement and require continual improvement in order to achieve the desired objectives.
1.3.1.1 Energy supply
Global primary energy use almost doubled from 5,363 Mtoe (225 EJ) in 1970 to 11,223 Mtoe (470 EJ) in 2004, with an average annual growth of 2.2% over this period. Fossil fuels accounted for 81% of total energy use in 2004 – slightly down from the 86% more than 30 years ago, mainly due to the increase in the use of nuclear energy. Despite the substantial growth of non-traditional renewable forms of energy, especially wind power, over the last decade, the share of renewables (including traditional biomass) in the primary energy mix has not changed compared with 1970 (see Chapter 4 , Section 4.2 ).
1.3.1.2 Intensities
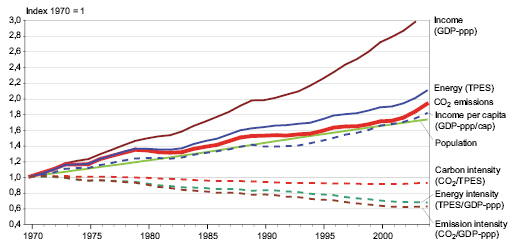
The Kaya identity ( Kaya, 1990 [NPR] ) is a decomposition that expresses the level of energy related CO2 emissions as the product of four indicators: (1) carbon intensity (CO2 emissions per unit of total primary energy supply (TPES)), (2) energy intensity (TPES per unit of GDP), (3) gross domestic product per capita (GDP/cap) and (4) population. The global average growth rate of CO2 emissions between 1970 and 2004 of 1.9% per year is the result of the following annual growth rates: population 1.6%, GDP/cap [12] 1.8%, energy-intensity of –1.2% and carbon-intensity –0.2% ( Figure 1.5 ).
A decomposition analysis according to the refined Laspeyeres index method ( Sun, 1998 [MoS] ; Sun and Ang, 2000 [MoS] ) is shown in Figure 1.6 . Each of the three stacked bars refers to 10-year periods and indicates how the net change in CO2 emissions of that decade can be attributed to the four indicators of the Kaya identity. These contributions – to tonnes of CO2 emissions – can be positive or negative, and their sum equals the net emission change (shown for each decade by the black line).
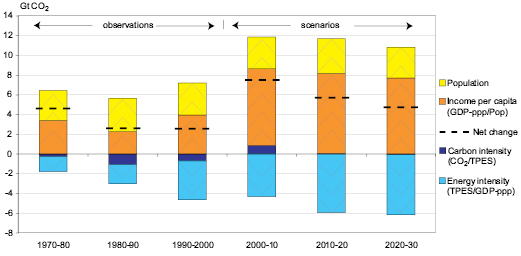
Figure 1.6: Decomposition of global energy-related CO2 emission changes at the global scale for three historical and three future decades.
GDP/capita and population growth were the main drivers of the increase in global emissions during the last three decades of the 20th century. However, consistently declining energy intensities indicate structural changes in the global energy system. The role of carbon intensity in offsetting emission growth has been declining over the last two decades. The reduction in carbon intensity of energy supply was the strongest between 1980 and 1990 due to the delayed effect of the oil price shocks of the 1970 s, and it approached zero towards the year 2000 and reversed after 2000 At the global scale, declining carbon and energy intensities have been unable to offset income effects and population growth and, consequently, carbon emissions have risen. Under the reference scenario of the International Energy Agency ( IEA, 2006a [NPR] ) these trends are expected to remain valid until 2030; in particular, energy is not expected to be further decarbonized under this baseline scenario.
Of the major countries and groups of countries – North America, Western Europe, Japan, China, India, Brazil, Transition Economies – only the Transition Economies (refers to 1993 – 2003 only) and, to a lesser extent, the group of the EU15 have reduced their CO2 emissions in absolute terms.
The decline of the carbon content of energy (CO2/TPES) was the highest in Western Europe, but the effect led only to a slight reduction of CO2 in absolute terms. Together with Western Europe and the Transition Countries, USA/Canada, Japan and – to a much lesser extent – Brazil have also reduced their carbon intensity.
Declining energy intensities observed in China and India have been partially offset by increasing carbon intensities (CO2/TPES) in these countries. It appears that rising carbon intensities accompany the early stages of the industrialization process, which is closely linked to accelerated electricity generation mainly based on fossil fuels (primarily coal). In addition, the emerging but rapidly growing transport sector is fuelled by oil, which further contributes to increasing carbon intensities. Stepped-up fossil fuel use, GDP/capita growth and, to a lesser extent, population growth have resulted in the dramatic increase in carbon emissions in India and China.
The Transition Economies of Eastern Europe and the former Soviet Union suffered declining per capita incomes during the 1990 s as a result of their contracting economies and, concurrently, total GHG emissions were greatly reduced. However, the continued low level of energy efficiency in using coal, oil and gas has allowed only moderate improvements in carbon and energy intensities. Despite the economic decline during the 1990 s, this group of countries accounted for 12% of global CO2 emissions in 2003 ( Marland et al., 2006 [NPR] ).
The challenge – an absolute reduction of global GHG emissions – is daunting. It presupposes a reduction of energy and carbon intensities at a faster rate than income and population growth taken together. Admittedly, there are many possible combinations of the four Kaya identity components, but with the scope and legitimacy of population control subject to ongoing debate, the remaining two technology-oriented factors, energy and carbon intensities, have to bear the main burden.
1.3.1.3 Energy security
With international oil prices fluctuating around 70 USD per barrel (Brent Crude in the first half of 2006; EIA, 2006a [NPR] ) and with prices of internationally traded natural gas, coal and uranium following suit, concerns of energy supply security are back on the agenda of many public and private sector institutions. Consequently, there is renewed public interest in alternatives to fossil fuels, especially to oil, resulting in new technology initiatives to promote hydrogen, biofuels, nuclear power and renewables ( Section 1.3.1.3 ). Higher oil prices also tend to open up larger markets for more carbon-intensive liquid fuel production systems, such as shale oil or tar sands. However, first and foremost, energy security concerns tend to invigorate a higher reliance on indigenous energy supplies and resources. Regions where coal is the dominant domestic energy resource tend to use more coal, especially for electricity generation, which increases GHG emissions. In recent years, intensified coal use has been observed for a variety of reasons in developing Asian countries, the USA and some European countries. In a number of countries, the changing relative prices of coal to natural gas have changed the dispatch order in power generation in favour of coal.
Energy security also means access to affordable energy services by those people – largely in developing countries – who currently lack such access. It is part and parcel of sustainable development and plays a non-negligible role in mitigating climate change. Striving for enhanced energy security can impact GHG emissions in opposite ways. On the one hand, GHG emissions may be reduced as the result of a further stimulation of rational energy use, efficiency improvements, innovation and the development of alternative energy technologies with inherent climate benefits. On the other hand, measures supporting energy security may lead to higher GHG emissions due to stepped-up use of indigenous coal or the development of lower quality and unconventional oil resources.
1.3.2 Future outlook
1.3.2.1 Energy supply
A variety of projections of the energy picture have been made for the coming decades. These differ in terms of their modelling structure and input assumptions and, in particular, on the evolution of policy in the coming decades. For example, the IEA’s World Energy Outlook 2006 reference case ( IEA, 2006a [NPR] ) and the the International Energy Outlook of the Energy Information Agency in the USA reference case ( EIA, 2006b [NPR] ) have both developed sets of scenarios; however, all of these scenarios project a continued dependence on fossil fuels (see Chapter 4 for past global energy mixes and future energy demand and supply projections). Should there be no change in energy policies, the energy mix supplied to run the global economy in the 2025 – 2030 time frame will essentially remain unchanged with about 80% ( IEA, 2006a [NPR] ) of the energy supply based on fossil fuels. In other words, the energy economy may evolve, but not radically change unless policies change.
According to the IEA and EIA projections, coal (1.8–2.5% per year), oil (1.3–1.4% per year) and natural gas (2.0–2.4% per year) all continue to grow in the period up to 2030 . Among the non-fossil fuels, nuclear (0.7–1.0% per year), hydro (2.0% per year), biomass and waste, including non-commercial biomass (1.3% per year), and other renewables (6.6% per year) [13] also continue to grow over the projection period. The growth of new renewables, while robust, starts from a relatively small base. Sectoral growth in energy demand is principally in the electricity generation and transport sectors, and together these will account for 67% of the increase in global energy demand up to 2030 ( IEA 2006a [NPR] ).
1.3.2.2 CO2 emissions
Global growth in fossil fuel demand has a significant effect on the growth of energy-related CO2 emissions: both the IEA and the U.S. EIA project growth of more than 55% in their respective forecast periods. The IEA projects a 1.7% per year growth rate to 2030, while the U.S. EIA projects a 2.0% per year rate in the absence of additional policies. According to IEA projections, emissions will reach 40.4 GtCO2 in 2030, an increase of 14.3 GtCO2 over the 2004 level. SRES [14] ( IPCC, 2000a [NPR] ) CO2 emissions from energy use for 2030 are in the range 37.2–53.6 GtCO2, which is similar to the levels projected in the EMF-21 [15] ( EMF, 2004 [NPR, MoS] ) scenarios reviewed in Chapter 3 , Section 3.2.2 (35.9–52.1 GtCO2). Relative to the approximately 25.5 GtCO2 emissions in 2000 (see Fig 1.1), fossil fuel-sourced CO2 emissions are projected to increase by 40–110% by 2030 in the absence of climate policies in these scenarios (see Figure 1.7 ).
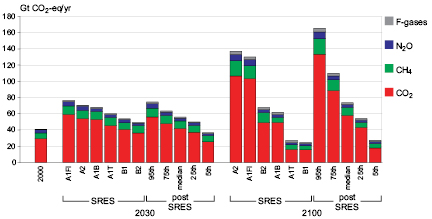
Figure 1.7 Global GHG emissions for 2000 and projected baseline emissions for 2030 and 2100 from IPCC SRES and the post-SRES literature. The figure provides the emissions from the six illustrative SRES scenarios. It also provides the frequency distribution of the emissions in the post-SRES scenarios (5th, 25th, median, 75th, 95th percentile), as covered in Chapter 3 . F-gases include HFCs, PFCs and SF6
As the bulk of the growing energy demand occurs in developing countries, the CO2 emission growth accordingly is dominated by developing countries. The latter would contribute two thirds to three quarters of the IEA-projected increase in global energy-related emissions. Developing countries, which accounted for 40% of total fossil fuel-related CO2 emissions in 2004, are projected to overtake the Organization for Economic Co-operation and Development (OECD) as the leading contributor to global CO2 fossil fuel emissions in the early part of the next decade.
The CO2 emission projections account for both growth in energy demand and changes in the fuel mix. The IEA projects the share of total energy-related emissions accounted for by gas to increase from 20% in 2004 to 22% in 2030, while the share of coal increases from 41% to 43% and oil drops by approximately 4%, from 39% to 35%, respectively, of the total. On the basis of sectoral shares at the global level, power generation grows from a 41% to a 44% share, while the 20% share of transport is unchanged. The fastest emissions growth rate is in power generation – at 2.0% per year – followed by transport at 1.7% per year. The industry sector grows at 1.6% per year, the residential/commercial sector at 1% per year and international marine and aviation emissions at 0.7% per year.
The SRES range of energy-related CO2 emissions for 2100 is much larger, 15.8–111.2 GtCO2, while the EMF-21 scenario range for 2100 is 53.6–101.4 GtCO2.
1.3.2.3 Non- CO2 gases
Methane. Atmospheric CH4 concentrations have increased throughout most of the 20th century, but growth rates have been close to zero over the 1999 – 2005 period ( Solomon et al., 2007 [NPR, PoC, 2007] ; 2.1.1) due to relatively constant emissions during this period equaling atmospheric removal rates ( Solomon et al., 2007 [NPR, PoC, 2007] ; 2.1.1). Human emissions continue to dominate the total CH4 emissions budget ( Solomon et al., 2007 [NPR, PoC, 2007] ; 7.4.1). Agriculture and forestry developments are assessed in Chapters 8 and 9 , respectively, in terms of their impact on the CH4 sink/source balance and mitigation strategies; waste handling is likewise assessed in Chapter 10 .
The future increase in CH4 concentrations up to 2030 according to the SRES scenarios ranges from 8.1 GtCO2-eq to 10.3 GtCO2-eq (increase of 19–51% compared to 2000 ), and the increase under the Energy Modeling Forum (EMF)-21 baseline scenarios is quite similar (7.5 GtCO2-eq to 11.3 GtCO2-eq/yr). By 2100, the projected SRES increase in CH4 concentrations ranges from 5 GtCO2-eq to 18.7 GtCO2-eq (a change of –27% to +175% compared to 2000 ) and that of the EMF-21 ranges from 5.9 to 29.2 GtCO2-eq (a change of –2% to +390%).
Montreal gases. Emissions of ODS gases (also GHGs) controlled under the Montreal Protocol (CFCs, HCFCs) increased from a very low amount during the 1950 – 1960 s to a substantial percentage – approximately 20% – of total GHG emissions by 1975 . This percentage fluctuated slightly during the period between 1975 and 1989, but once the phase-out of CFCs was implemented, the ODS share in total GHG emissions fell rapidly, first to 8% ( 1995 ) and then to 4% ( 2000 ). Radiative forcing from these gases peaked in 2003 and is beginning to decline ( Forster et al., 2007 [NPR, MoS, 2007] ).
After 2000, ODS contributed 3–4% to total GHG emissions ( Olivier et al., 2005 [SRC] , 2006 ). The ODS share is projected to decrease yet further due to the CFC phase-out in developing countries. Emissions of ODS are estimated at 0.5–1.15 Gt CO2-eq for the year 2015, dependent on the scenario chosen ( IPCC, 2005 [NPR] ); this would be about 1–2% of total GHG emissions for the year 2015, if emissions of all other GHGs are estimated at about 55 Gt CO2-eq (for the year 2015 ). The percentage of HCFC emissions in the total of CFC and HCFC emissions for the year 2015 is projected to be about 70%, independent of the scenario chosen.
Nitrous oxide. Atmospheric concentrations of N2O have been continuously increasing at an approximately constant growth rate since 1980 ( IPCC, 2007a [NPR, 2007] , SPM). Industrial sources, agriculture, forestry and waste developments are assessed in this report in terms of their impact on the N2O sink/source balance and mitigation strategies. The SRES emissions for 2030 range from 3 GtCO2-eq to 5.3 GtCO2-eq (a change of –13% to 55% compared to 2000 ). For comparison, the recent EMF-21 baseline range for 2030 is quite close to this (2.8 GtCO2-eq to 5.4 GtCO2-eq, an increase of –17% to 58% compared to 2000 ). By 2100, the range projected by the SRES scenarios is 2.6 GtCO2-eq to 8.1 GtCO2-eq (an increase of –23% to 140% compared to 2000 ), whereas the EMF-21 range is a little higher (3.2 GtCO2-eq to 11.5 GtCO2-eq, or an increase of –5% to 240% compared to 2000 ).
Fluorinated gases. Concentrations of many of these gases have increased by large factors (i.e., 1.3 and 4.3) between 1998 and 2005, and their radiative forcing is rapidly increasing (from low levels) by roughly 10% per year ( Forster et al., 2007 [NPR, MoS, 2007] ). Any projection of overall environmental impacts and emissions is complicated by the fact that several major applications retain the bulk of their fluorinated gases during their respective life cycles, resulting in the accumulation of significant stocks that need to be responsibly managed when these applications are eventually decommissioned. A comprehensive review of such assessments was published in an earlier IPCC Special Report ( IPCC, 2005 [NPR] ). This review reported growth in HFC emissions from about 0.4 GtCO2-eq in 2002 to 1.2 GtCO2-eq per year in 2015 . Chapter 3 also describes in some detail the results of long-term GHG emissions scenarios. The range projected by SRES scenarios for 2030 is 1.0–1.6 GtCO2-eq (increase of 190–360% compared to 2000 ) and the EMF-21 baseline scenarios are quite close to this (1.2–1.7 GtCO2-eq per year, an increase of 115–240% compared to 2000 ). By 2100, the SRES range is 1.4–4 GtCO2-eq per year (an increase of 300% to more than 1000 % compared to 2000 ), whereas the new EMF-21 baseline scenarios are higher still (1.9–6.3 GtCO2-eq).
Air pollutants and other radiative substances. As noted above, some air pollutants, such as sulphur aerosol, have a significant effect on the climate system, although considerable uncertainties still surround the estimates of anthropogenic aerosol emissions. Data on non-sulphur aerosols are sparse and highly speculative, but in terms of global sulphur emissions, these appear to have declined from a range of 75 ± 10 MtS in 1990 to 55–62 MtS in 2000 . Sulphur emissions from fossil fuel combustion lead to the formation of aerosols that affect regional climate and precipitation patterns and also reduce radiative forcing. There has been a slowing in the growth of sulphur emissions in recent decades, and more recent emission scenarios show lower emissions than earlier ones ( Chapter 3 , Section 3.2.2 ). Other air pollutants, such as NOx and black and organic carbon, are also important climatologically and adversely affect human health. The likely future development of these emissions is described in Section 3.2.2 .
1.3.2.4 Total GHG emissions
Without additional policies global GHG emissions (including those from deforestation) are projected to increase between 25% and 90% by 2030 relative to 2000 (see Figure 1.7 ). Fossil fuel dominance is expected to continue up to 2030 and beyond; consequently, CO2 emissions from energy use tend to grow faster than total GHGs, increasing by 1.2–2.5% over that period. Two thirds to three quarters of the increase in CO2 emissions are projected to come from developing countries, although the average per capita CO2 emissions in developing country regions will remain substantially lower (2.8– 5.1 tCO2 per capita) than those in developed country regions (9.6–15.1 tCO2 per capita).
By 2100, the range in the GHG emission projections is much wider from a 40% reduction to an increase of 250% compared to 2000 . Scenarios that account for climate policies currently under discussion for implementation also show global emissions rising for many decades. With the atmospheric concentrations of GHGs thus unlikely to stabilize in this century (even for the low SRES scenario) without major policy changes, from an emissions perspective, we are not on track for meeting the objectives of UNFCCC Article 2.
1.3.3 Technology research, development and deployment: needs and trends
1.3.3.1 Research and development
Technology research and development (R&D) are important for altering the emission trends shown in the previous sections. In the absence of measures fostering the development of climate-friendly technologies and/or a lack of incentives for their deployment, however, it is not a priori obvious in which direction R&D will influence emissions. Because of the longevity of energy infrastructures (lock-in effect), it is the near-term investment decisions in the development, deployment and diffusion of technologies that will determine the long-term development of the energy system and its emissions (Gritsevskyi and Nakicenovic, 2002 [NotFound] ).
Generally speaking, it would be economically impossible without technology research, development, demonstration, deployment and diffusion (RDDD&D) and induced technology change (ITC), to stabilize GHG concentrations at a level that would prevent dangerous anthropogenic interference with the climate system. Government support is crucial at the development stage, but private investment will gradually replace the former for deployment (creating necessary market transformation) and for diffusion (successful market penetration).
However, RDDD&D alone is insufficient and effective climate policies are also required ( Baker et al., 2006 [NPR, ARC] ). A recent international modelling comparison exercise ( Edenhofer et al., 2006 [NPR, SRC] ) has shown that ITC not only has the potential to reduce mitigation costs substantially but that it is also essential to the stabilization of concentration levels of CO2, avoiding dangerous anthropogenic interference.
There are various types of technologies that can play significant roles in mitigating climate change, including energy efficiency improvements throughout the energy system (especially at the end use side); solar, wind, nuclear fission and fusion and geothermal, biomass and clean fossil technologies, including carbon capture and storage; energy from waste; hydrogen production from non-fossil energy sources and fuel cells ( Pacala and Socolow, 2004 [JoC] ; IEA, 2006b [NPR] ). Some are in their infancy and require public RDDD&D support, while others are more mature and need only market incentives for their deployment and diffusion. Some also need persevering efforts for public acceptance ( Tokushige et al., 2006 [NPR] ) as well as the resolution of legal and liability issues.
1.3.3.2 Research and development expenditures
The most rapid growth in public-sector energy related technology R&D [16] occurred in the aftermath of the oil price shocks of the 1970 s. There is no evidence yet of a similar response from the latest price surges. A technology R&D response to the challenge of climate mitigation has not occurred. Energy technology R&D has remained roughly constant over the last 15 years despite the fact that climate change has become a focus of international policy development. Energy technology R&D is one policy lever that governments have for encouraging a more climate friendly capital, a strengthened publicly funded commitment to technology development could play an important role in altering the trends in GHG emissions.
International cooperation in the field of technology R&D may provide the leverage to otherwise insufficient national R&D budgets. Several international partnerships on the development of cleaner technologies have been created (see Section 1.4.2 ).
1.3.3.7 Equity
Equity is an ethical construct that demands the articulation and implementation of choices with respect to the distribution of rights to benefits and the responsibilities for bearing the costs resulting from particular circumstances – for example, climate change – within and among communities, including future generations. Climate change is subject to a very asymmetric distribution of present emissions and future impacts and vulnerabilities. Equity can be elaborated in terms of distributing the costs of mitigation or adaptation, distributing future emission rights and ensuring institutional and procedural fairness ( Chapter 13 , Section 13.3.4.3 ). Equity also exhibits preventative (avoidance of damage inflicted on others), retributive (sanctions), and corrective elements (e.g. ‘common but differentiated responsibilities’) ( Chapter 2 , Section 2.6 ), each of which has an important place in the international response to the climate change problem ( Chapter 13 ).
1.4 Institutional architecture
The institutional architecture for climate change, energy and sustainable development in principal covers a wide range of different entities and processes. At the international level, these include the Millennium Development Goals, the World Summit on Sustainable Development in 2002 and its Johannesburg Plan for Implementation (JPOI) and the UN Commission on Sustainable Development (CSD), all of which have broad and important connections to climate change in the context of sustainable development, energy and poverty eradication. Other international fora that are important to advancing the agenda for sustainable development and climate change include – but are not limited to – the UN General Assembly, the G8 Dialogue on Climate Change, Clean Energy and Sustainable Development, OECD, the World Trade Organization (WTO; which pursues trade liberalization, important for technology transfers), IEA and the World Bank. More regional fora include regional banks, the EU and the Asia-Pacific Partnership on Clean Development and Climate for transferring and deploying clean technologies and building up human and institutional capacity. Chapter 2 .1 discusses these issues in detail, and they are further evaluated in Chapter 12 . This chapter focuses specifically on the UNFCCC and its Kyoto Protocol and with technology cooperation and transfer.
1.4.1 UNFCCC and its Kyoto Protocol
- Equity, which is expressed as “common but differentiated responsibilities” that assigns the lead in mitigation to developed countries (Article 3.1) and that takes the needs and special circumstances of developing countries into account (Article 3.2).
- A precautionary principle, which says that “where there are threats of serious or irreversible damage, lack of full scientific certainty should not be used as a reason for postponing such measures, taking into account that policies and measures to deal with climate change should be cost-effective so as to ensure global benefits at the lowest possible cost” (Article 3.3).
- A right to and an obligation to promote sustainable development (Article 3.4).
- An obligation to cooperate in sharing information about climate change, technologies through technology transfers, and the coordination of national actions (Article 3.7)
Based on the principle of common but differentiated responsibilities, Annex I countries are committed to adopt policies and measures aimed at returning – individually or jointly – their GHG emissions to earlier levels by the year 2000 (Article 4.2). Following the decision of the first Conference of the Parties [17] (COP1) in Berlin in 1995 that these commitments were inadequate, the Kyoto Protocol was negotiated and adopted by consensus at COP3, in Kyoto in 1997, and entered into force on 16 February 2005 . This was preceded by the detailed negotiation of the implementing rules and agreements for the Protocol – the Marrakech Accords – that were concluded at COP7 in Marrakech and adopted in Montreal at CMP1 [18] . As of December 2006, the Protocol has been ratified by 165 countries. While Australia and the United States, both parties to UNFCCC, signed the protocol, both have stated an intention not to ratify.
Several key features of the Protocol are relevant to the issues raised later in this report:
- Each Party listed in Annex B of the Protocol is assigned a legally binding quantified GHG emission limitation and/or reduction measured in CO2 equivalents for the first commitment period 2008–2012. In aggregate, these Parties are expected to reduce their overall GHG emissions by “at least 5 per cent below 1990 levels in the commitment period 2008 to 2012” (Article 3.1). Some flexibility is shown towards economies in transition who may nominate a base year or period other than 1990 (Article 3.5, 3.7).
- Six classes of gases are listed in Annex A of the Protocol: CO2, CH4, N2O, HFCs, PFCs and SF6. Emissions from international aviation and maritime transport are not included.
- The so-called Kyoto flexibility mechanisms allow Annex B Parties to obtain emission allowances achieved outside their national borders but supplemental to domestic action, which is expected to be a “significant element of the effort” (Article 6.1 (d), Article17, CMP1 [19] ). These mechanisms are: an international emission trading system, Joint Implementation (JI) projects in Economies in Transition, projects undertaken as of year 2000 in developing (non-Annex I) countries under the Clean Development Mechanism (CDM) and carbon sink projects in Annex B countries.
- A set of procedures for emission monitoring, reporting, verification and compliance has been adopted at CMP1 under Articles 5, 7, 8 and 18.
In accordance with Article 3.9, the Parties to the Protocol at CMP1 began the process of negotiating commitments for the Annex B Parties for the second commitment period, creating – the ‘Ad Hoc Working Group on Further Commitments for Annex I Parties under the Kyoto Protocol’ (AWG), with the requirement that negotiations be completed so that that the first and second commitment periods are contiguous. Work continued at CMP2 in Nairobi and in 2007 the AWG will work on, amongst other thing, ranges of emission reduction objectives of Annex I Parties with due attention to the conditions mentioned in Article 2 of the Convention (see 1.2.1). The task is to consider that “according to the scenarios of the TAR, global emissions of carbon dioxide have to be reduced to very low levels, well below half of levels in 2000, in order to stabilize their concentrations in the atmosphere” (see Chapters 3 and 13 ).
In addition, CMP2 started preparations for the second review of the Protocol under Article 9, which in principle covers all aspects of the Protocol, and set 2008 as the date for this review.
Under the UNFCCC, a Dialogue on Long-Term Cooperation Action to Address Climate Change by Enhancing Implementation of the Convention (the Dialogue) was established at COP11 in 2005, met during 2006 and is to conclude at COP13 in 2007 . The Dialogue is “without prejudice to any future negotiations, commitments, process, framework or mandate under the Convention, to exchange experiences and analyse strategic approaches for long-term cooperative action to address climate change”.
1.4.2 Technology cooperation and transfer
Effective and efficient mitigation of climate change depends on the rate of global diffusion and transfer of new as well as existing technologies. To share information and development costs, international cooperation initiatives for RDDD&D, such as the Carbon Sequestration Leadership Forum (CSLF), the International Partnership for Hydrogen Economy (IPHE), the Generation IV International Forum (GIF), the Methane to Markets Partnership and the Renewable Energy & Energy Efficiency Partnership (REEEP), the Global Bioenergy Partnership and the ITER fusion project, were undertaken. Their mandates range from basic R&D and market demonstration to barrier removals for commercialization/diffusion. In addition, there are 40 ‘implementing agreements’ facilitating international cooperation on RDDD&D under IEA auspices, covering all of the key new technologies of energy supply and end use with the exception of nuclear fission ( IEA, 2005 [NPR] ).
Regional cooperation may be effective as well. Asia-Pacific Partnership of Clean Development and Climate (APPCDC), which was established by Australia, China, India, Japan, Korea and the USA in January 2006, aims to address increased energy needs and associated challenges, including air pollution, energy security, and climate change, by enhancing the development, deployment and transfer of cleaner, more efficient technologies. In September 2005, the EU concluded agreements with India and China, respectively, with the aim of promoting the development of cleaner technologies (India) and low carbon technologies (China).
Bilateral sector-based cooperation agreements also exist. One example is the Japan/China agreement on energy efficiency in the steel industry, concluded in July 2005 JISF,Bilateral sector-based cooperation agreements also exist. One example is the Japan/China agreement on energy efficiency in the steel industry, concluded in July 2005 JISF,). These sector-based initiatives may be an effective tool for technology transfer and mitigating GHG emissions.
It is expected that CDM and JI under the Kyoto Protocol will play important role for technology transfer as well.
1.5 Changes from previous assessments and roadmap
1.5.1 Previous assessments
The IPCC was set up in 1988 by UNEP and WMO with three working groups: to assess available scientific information on climate change (WGI), to assess environmental and socio-economic impacts (WGII) and to formulate response strategies (WGIII).
The First Assessment Report (FAR) ( IPCC, 1991 [NPR] ) dealt with the anthropogenic alteration of the climate system through CO2 emissions, potential impacts and available cost-effective response measures in terms of mitigation, mainly in the form of carbon taxes without much concern for equity issues ( IPCC, 2001 [NPR] , Chapter 1).
For the Second Assessment Report (SAR), in 1996, Working Groups II and III were reorganized ( IPCC, 1996 [NPR] ). WGII dealt with adaptation and mitigation, and WGIII dealt with the socio-economic cross-cutting issues related to costing climate change’s impacts and providing cost-benefit analysis (CBA) for use in decision-making. The socio-institutional context was emphasized as well as the issues of equity, development, and sustainability ( IPCC, 2001 [NPR] , Chapter 1).
For the Third Assessment Report (TAR) ( IPCC, 2001 [NPR] ), Working Groups II and III were again reorganized to deal with adaptation and mitigation, respectively. The concept of mitigative capacity was introduced, and the focus attention was shifted to sustainability concerns ( IPCC, 2001 [NPR] , Chapter 1.1). Four cross-cutting issues were identified: costing methods, uncertainties, decision analysis frameworks and development, equity and sustainability ( IPCC, 2000b [NPR] ).
The Fourth Assessment Report (AR4) summarizes the information contained in previous IPCC reports - including the IPCC special reports on Carbon Dioxide Capture and Storage, on Safeguarding the Ozone Layer and on the Global Climate System published since TAR - and assesses the scientific literature published since 2000 .
Although the structure of AR4 resembles the macro-outline of the TAR, there are distinct differences between them. The AR4 assigns greater weight to (1) a more detailed resolution of sectoral mitigation options and costs; (2) regional differentiation; (3) emphasizing previous and new cross-cutting issues, such as risks and uncertainties, decision- and policy-making, costs and potentials and the relationships between mitigation, adaptation and sustainable development, air pollution and climate, regional aspects and the issues related to the implementation of UNFCCC Article 2; and (4) the integration of all these aspects.
1.5.2 Roadmap
This report assesses options for mitigating climate change. It has four major parts, A–D.
Part A comprises Chapter 1 , an Introduction and Chapter 2 , which is on ‘framing issues’. Chapter 2 introduces the report’s cross-cutting themes, which are listed above, and outlines how these themes are treated in subsequent chapters. It also introduces important concepts (e.g. cost-benefit analysis and regional integration) and defines important terms used throughout the report.
Part B consists of one chapter, Chapter 3 . This chapter reviews and analyzes baseline (non-mitigation) and stabilization scenarios in the literature that have appeared since the publications of the IPCC SRES and the TAR. It pays particular attention to the literature that criticizes the IPCC SRES scenarios and concludes that uncertainties and baseline emissions have not changed very much. It discusses the driving forces for GHG emissions and mitigation in the short and medium terms and emphasizes the role of technology relative to social, economic and institutional inertia. It also examines the relation between adaptation, mitigation and avoided climate change damage in the light of decision-making on atmospheric GHG concentrations (Article 2 UNFCCC).
Part C consists of seven chapters, each of which assesses sequence mitigation options in different sectors. Chapter 4 addresses the energy supply sector, including carbon capture and storage; Chapter 5 transport and associated infrastructures; Chapter 6 the residential, commercial and service sectors; Chapter 7 the industrial sector, including internal recycling and the reuse of industrial wastes; Chapters 8 and 9 the agricultural and forestry sectors, respectively, including land use and biological carbon sequestration; Chapter 10 waste management, post-consumer recycling and reuse.
These seven chapters use a common template and cover all relevant aspects of GHG mitigation, including costs, mitigation potentials, policies, technology development, technology transfer, mitigation aspects of the three dimensions of sustainable development, system changes and long-term options. They provide the integrated picture that was absent in the TAR. Where supporting literature is available, they address important differences across regions.
Part D comprises three chapters (11–13) that focus on major cross-sectoral considerations. Chapter 11 assesses the aggregated short-/medium-term mitigation potential, macro-economic impacts, economic instruments, technology development and transfer and cross-border influences (or spill-over effects). Chapter 12 links climate mitigation with sustainable development and assesses the GHG emission impacts of implementing the Millennium Development Goals and other sustainable development policies and targets. Chapter 13 assesses domestic climate policy instruments and the interaction between domestic climate policies and various forms of international cooperation and reviews climate change as a global common issue in the context of sustainable development objectives and policies. It summarizes relevant treaties, cooperative development agreements, private–public partnerships and private sector initiatives and their relationship to climate objectives.
REFERENCES
Baker, T., H. Pan, J. Kohler, R. Warren, and S. Winne, 2006: Avoiding Dangerous Climate Change by Inducing Technological Progress: Scenarios Using a Large-Scale Econometric Model. In Avoiding Dangerous Climate Change, H.J. Schellnhuber (editor in chief), Cambridge University Press, pp. 361-371. [NPR, ARC]
Bolin, B. and H.S. Kheshgi, 2001: On strategies for reducing greenhouse gas emissions. Proceedings of the National Academy of Sciences of the United States of America, 24 April, 2001, 98(9), pp. 4850-4854. [NPR, ARC]
CEC, 2006: Report from the Commission: Progress Towards Achieving the Kyoto Objectives. SEC(2006) 1412, Commission of the European Communities, Brussels, Belgium. [NPR]
CEU, 2005: Presidency Conclusions - Brussels, 22 and 23 March 2005 - IV. Climate Change, European Commission, Council of the European Union, Brussels, Belgium. <http://www.eu2005.lu/en/actualites/conseil/2005/03/23conseileuropen/ceconcl.pdf> accessed 25 April 2006. [NPR]
Chandler, W., R. Schaeffer, Z. Dadi, P.R. Shukla, F. Tudela, O. Davidson and S. Alpan-Atamer, 2002: Climate change mitigation in developing countries: Brazil, China, India, Mexico, South Africa, and Turkey. Pew Center on Global Climate Change. [NPR, SRC]
Dasgupta, P., 2006: Comments on the Stern Review’s Economics of Climate Change. <http://www.econ.cam.ac.uk/faculty/dasgupta/STERN.pdf> accessed 15. December 2006. [NPR]
Denman, K.L., G. Brasseur, A. Chidthaisong, P. Ciais, P.M. Cox, R.E. Dickinson, D. Hauglustaine, C. Heinze, E. Holland, D. Jacob, U. Lohmann, S Ramachandran, P.L. da Silva Dias, S.C. Wofsy and X. Zhang, 2007: Couplings Between Changes in the Climate System and Biogeochemistry. In: Climate Change 2007: The Physical Science Basis. Contribution of Working Group I to the Fourth Assessment Report of the Intergovernmental Panel on Climate Change [Solomon, S., D. Qin, M. Manning, Z. Chen, M. Marquis, K.B. Averyt, M.Tignor and H.L. Miller (eds.)]. Cambridge University Press, Cambridge, United Kingdom and New York, NY, USA. [NPR, ARC, 2007]
Edenhofer, O., Lessmann, K., Kemfert, C., Grubb, M. and Koehler, J., 2006: Induced Technological Change: Exploring its Implications for the Economics of Atmospheric Stabilisation. Synthesis Report from the Innovation Modelling Comparison Exercise. In Endogenous Technological Change and the Economics of Atmospheric Stabilisation, O. Edenhofer, C. Carraro, J. Köhler, M. Grubb. The Energy Journal, Special Issue #1. [NPR, SRC]
EEA, 2006: EN09_EU-25_Policy_effectiveness (Underpinning Energy and Environment indicator fact-sheets for Energy and environment in the European Union - Tracking progress towards integration, EEA Report No 8/2006). European Environment Agency. [NPR]
EIA, 2006a: U.S. Department of Energy, Energy Information Administration, Washington, D.C., 20585, <http://www.eia.doe.gov/emeu/international/crude1.html>, accessed 15. December 2006. [NPR]
EIA, 2006b: International Energy Outlook 2006. DOE/EIA-0484(2006), U.S. Department of Energy, Energy Information Administration, Washington, D.C., 20585. [NPR]
Eichhammer, W., F. Gagelmann, J. Schleich and J. Chesshire, 2002: Reasons and Perspectives for Emission Reductions in Germany and the UK. Fraunhofer Institute, <http://www.isi.fhg.de/publ/downloads/isi02a08/emission-reduction.pdf>, accessed 24 January 2007. [NPR]
Eichhammer, W., U. Boede, F. Gagelmann, E. Jochem, J. Schleich, B. Schlomann, J. Chesshire and H-J. Ziesing, 2001: Greenhouse Gas Reductions in Germany and the UK - Coincidence or Policy Induced. An analysis for international climate policy. Fraunhofer Institute, Science Policy and Technology Research (SPRU), Deutsches Institut für Wirtschaftsforschung (DIW). <http://www.isi.fhg.de/publ/downloads/isi01b20/greenhouse-gas.pdf>, accessed 20. April 2006. [NPR, ARC]
EMF, 2004: Energy Modeling Forum Study 21: Multi-gas Mitigation Scenarios. Energy Modeling Forum, <http://www.stanford.edu/group/EMF>, accessed 10. December 2006. [NPR, MoS]
Forster, P., V. Ramaswamy, P. Artaxo, T. Berntsen, R. Betts, D.W. Fahey, J. Haywood, J. Lean, D.C. Lowe, G. Myhre, J. Nganga, R. Prinn, G. Raga, M. Schulz and R. Van Dorland, 2007: Changes in Atmospheric Constituents and in Radiative Forcing. In Climate Change 2007: The Physical Science Basis. Contribution of Working Group I to the Fourth Assessment Report of the Intergovernmental Panel on Climate Change [Solomon, S., D. Qin, M. Manning, Z. Chen, M. Marquis, K.B. Averyt, M.Tignor and H.L. Miller (eds.)]. Cambridge University Press, Cambridge, United Kingdom and New York, NY, USA. [NPR, MoS, 2007]
Gritsevsky, A., and N. Nakicenovic, 2002: Modelling uncertainty of induced technological change. In: Technological change and the environment, A. Grubler, N. Nakicenovic, W.D. Nordhaus, (eds.). Resources for the Future, pp. 251-279. [NPR, MoS, ARC]
Hansen, J., M. Sato, R. Ruedy, K. Lo, D.W. Lea, and M. Medina-Elizade, 2006: Global temperature change. PNAS: 0606291103. [NPR]
Harvey, L.D.D., 2007: Dangerous Anthropogenic Interference, Dangerous Climatic Change, and Harmful Climate Change: Non Trivial Distinctions with Significant Policy Implications. Climate Change, 82(1-2), pp.1-25. <http://www.springerlink.com/content/k761w23w3506/> accessed 07/06/07. [2007]
Hooijer, A., M. Silvius, H. Wösten, and S. Page, 2006: PEAT- CO2, Assessment of CO2 emissions from drained peatlands in SE Asia. Delft Hydraulics report Q3943. [NPR]
IEA, 2005: Energy Technologies at the cutting edge. International Energy Agency, Paris, France. [NPR]
IEA, 2006a: World Energy Outlook 2006. Paris, France. [NPR]
IEA, 2006b: Energy Technology Perspectives: Scenarios and Strategies to 2050. Paris, France. [NPR]
IPCC, 1991: The First Assessment Report of the Intergovernmental Panel on Climate Change (IPCC). Cambridge University Press, Cambridge. [NPR]
IPCC, 1996: The Second Assessment Report of the Intergovernmental Panel on Climate Change (IPCC). Cambridge University Press, Cambridge. [NPR]
IPCC, 2000a: Emissions Scenarios. [Nakicenovic, N. and R. Swart (eds.)]. Special Report of the Intergovernmental Panel on Climate Change (IPCC). Cambridge University Press, Cambridge, 570 pp. [NPR]
IPCC, 2000b: Guidance papers on the Cross Cutting Issues of the Third Assessment Report of the Intergovernmental Panel on Climate Change (IPCC) [R. Pachauri, T. Taniguchi and K. Tanaka (eds.)]. Geneva, Switzerland. [NPR]
IPCC, 2001: Climate Change 2001: Mitigation - Contribution of Working Group III to the Third Assessment Report of the Intergovernmental Panel on Climate Change (IPCC) [Metz, B., O. Davidson, R. Swart, and J. Pan (eds.)]. Cambridge University Press, Cambridge, 700 pp. [NPR]
IPCC, 2005: Safeguarding the Ozone Layer and the Global Climate System: issues related to Hydrofluorocarbons and Perfluorocarbons [Metz, B., L. Kuijpers, S. Solomon, S.O. Andersen, O. Davidson, J. Pons, D.de Jager, T. Kestin, M. Manning, and L. Meyer (eds.)]. Special Report of the Intergovernmental Panel on Climate Change (IPCC), Cambridge University Press, Cambridge. [NPR]
IPCC, 2007a: Climate Change 2007: The Physical Science Basis. Contribution of Working Group I to the Fourth Assessment Report of the Intergovernmental Panel on Climate Change [Solomon, S., D. Qin, M. Manning, Z. Chen, M. Marquis, K.B.M.Tignor and H.L. Miller (eds.)]. Cambridge University Press, Cambridge, United Kingdom and New York, NY, USA, 996 pp. [NPR, 2007]
IPCC, 2007b: Climate Change 2007: Impacts, Adaptation and Vulnerability. Contribution of Working Group II to the Fourth Assessment Report of the Intergovernmental Panel on Climate Change [Parry, M.L., O.F. Canziani, J.P. Palutikof, P.J. van der Linden, C.E. Hanson (eds.)]. Cambridge University Press, Cambridge, United Kingdom and New York, NY, USA. [NPR, 2007]
JISF, 2005; Japan Iron and Steel federation <http://www.jisf.or.jp/en/activity/050715.html>, accessed 15. July 2006. [NPR]
Kaul, I., I. Grunberg, and M.A. Stern, 1999: Global Public Goods, Oxford University Press 1999. [NPR]
Kaul, I., P. Conceiçao, K. Le Gouven, and R.U. Mendoz, 2003: Providing Global Public Goods, Oxford University Press. [NPR]
Kaya, Y, 1990: Impact of Carbon Dioxide Emission Control on GNP Growth: Interpretation of Proposed Scenarios. Paper presented to the IPCC Energy and Industry Subgroup, Response Strategies Working Group, Paris. [NPR]
Marland, G., T.A. Boden, and R.J. Andres, 2006: Global, Regional, and National Fossil Fuel CO2 Emissions. In Trends: A Compendium of Data on Global Change. Carbon Dioxide Information Analysis Center, Oak Ridge National Laboratory, U.S. Department of Energy, Oak Ridge, Tenn., USA. [NPR]
Mastrandrea, M.D., and S.H. Schneider, 2004: Probabilistic Integrated Assessment of ‘Dangerous’ Climate Change. Science, 304(5670), pp. 571-575. [PoC, JoC, ARC]
Meehl, G.A., T.F. Stocker, W.D. Collins, P. Friedlingstein, A.T. Gaye, J.M. Gregory, A. Kitoh, R. Knutti, J.M. Murphy, A. Noda, S.C.B. Raper, I.G. Watterson, A.J. Weaver and Z.-C. Zhao, 2007: Global Climate Projections. In: Climate Change 2007: The Physical Science Basis. Contribution of Working Group I to the Fourth Assessment Report of the Intergovernmental Panel on Climate Change [Solomon, S., D. Qin, M. Manning, Z. Chen, M. Marquis, K.B. Averyt, M. Tignor and H.L. Miller (eds.)]. Cambridge University Press, Cambridge, United Kingdom and New York, NY, USA. [NPR, MoS, 2007]
Nordhaus, W.D., 2006: The Stern Review on the Economics of Climate Change. National Bureau of Economic Research, Working Paper 12741. Cambridge, Massachusetts, USA. [NPR]
Olivier, J.G.J., J.A. Van Aardenne, F. Dentener, V. Pagliari, L.N. Ganzeveld, and J.A.H.W. Peters, 2005: Recent trends in global greenhouse gas emissions: regional trends 1970-2000 and spatial distribution of key sources in 2000. Environmental Science, 2(2-3), pp. 81-99. DOI: 10.1080/15693430500400345. <http://www.mnp.nl/edgar/global_overview/>, accessed 5. December 2006. [SRC]
Olivier, J.G.J., T. Pulles and J.A. van Aardenne, 2006: Part III: Greenhouse gas emissions: 1. Shares and trends in greenhouse gas emissions; 2. Sources and Methods; Greenhouse gas emissions for 1990, 1995 and 2000. In CO2 emissions from fuel combustion 1971-2004, 2006 Edition, pp. III.1-III.41. International Energy Agency (IEA), Paris. ISBN 92-64-10891-2 (paper) 92-64-02766-1 (CD ROM) (2006). [NPR, SRC]
Pacala, S. and R. Socolow, 2004: Stabilization Wedges: Solving the Climate Problem for the Next 50 Years with Current Technologies. Science, 305, pp. 968-972. [JoC]
Ramankutty, N., et al., 2006: Challenges to estimating carbon emissions from tropical deforestation. Global Change Biology (published article online: 28-Nov-2006 doi: 10.1111/j.1365-2486.2006.01272.x). [NPR, MoS]
Rijsberman, F.J., and R.J. Swart (eds.), 1990: Targets and Indicators of Climate Change. Stockholm Environment Institute, 1666 pp. [NPR, ARC]
Solomon, S., D. Qin, M. Manning, R.B. Alley, T. Berntsen, N.L. Bindoff, Z. Chen, A. Chidthaisong, J.M. Gregory, G.C. Hegerl, M. Heimann, B. Hewitson, B.J. Hoskins, F. Joos, J. Jouzel, V. Kattsov, U. Lohmann, T. Matsuno, M. Molina, N. Nicholls, J.Overpeck, G. Raga, V. Ramaswamy, J. Ren, M. Rusticucci, R. Somerville, T.F. Stocker, P. Whetton, R.A. Wood and D. Wratt, 2007: Technical Summary. In: Climate Change 2007: The Physical Science Basis. Contribution of Working Group I to the Fourth Assessment Report of the Intergovernmental Panel on Climate Change [Solomon, S., D. Qin, M. Manning, Z. Chen, M. Marquis, K.B. Averyt, M. Tignor and H.L. Miller (eds.)]. Cambridge University Press, Cambridge, United Kingdom and New York, NY, USA. [NPR, PoC, 2007]
Stern, N., 2006: The Stern Review: The Economics of Climate Change. <http://www.hm-treasury.gov.uk/independent_reviews/stern_review_economics_climate_change/stern_review_report.cf>, accessed 28. November 2006. [NPR]
Sun, J.W., 1998: Changes in energy consumption and energy intensity: A complete decomposition model. Energy Economics 20(1), pp. 85-100. [MoS]
Sun, J.W. and B.W. Ang, 2000: Some properties of an exact energy decomposition model. Energy 25(12), pp. 1177-1188. [MoS]
Tokushige, K., K. Akimoto, and T. Tomoda, 2006: Public Acceptance and Risk-benefit Perception of CO2 Geological Storage for Global Warming Mitigation in Japan, Mitigation and Adaptation Strategies for Global Change. <http://springerlink.metapress.com/content/fj451l10258r3259/?p=7fa647f50f534>871b6234fdde58fac6a&pi=0> accessed January 10, 2007. [NPR]
UN, 1992: United Nations Framework Convention on Climate Change, United Nations, New York. [NPR]
Van der Werf, G.R., J.T. Randerson, G.J. Collatz, and L. Giglio, 2003: Carbon emissions from fires in tropical and subtropical ecosystems. Global Change Biology, 9, pp. 547-562. Clean
| Tag | Explanation | Occurrences | Percentages |
|---|---|---|---|
| PoC |
Person of Concern Key individual involved in CRU emails as defined in this spreadsheet. |
2 | 4% |
| JoC |
Journal of Concern A Journal which has published articles by one or more PoCs (Person of Concern) |
2 | 4% |
| MoS |
Model or Simulation Reference appears to be a model or simulation, not observation or experiment. |
7 | 14% |
| NPR |
Non Peer Reviewed Reference has no Journal or no Volume or no Pages or it has Editors. |
43 | 86% |
| SRC |
Self Reference Concern Author of a chapter containing references to own work. |
4 | 8% |
| ARC |
Paper authored or co-authored by person who is also in list of Authors of another chapter. |
7 | 14% |
| 2007 |
Paper dated 2007, when IPCC policy stated cutoff was December 2005 |
7 | 14% |
| Clean |
The reference was probably peer reviewed. |
1 | 2% |
NOTE: In the Summary of Reviewer Comments,
Accepted includes only those responses that were unambiguously Accepted.
There are other categories of responses that we have not yet quantified
due to inconsistencies of usage.
| Reviewer | Total Comments | Accepted | IPCC Roles | Papers |
|---|---|---|---|---|
| Government of Australia | 63 | 32 | 0 | 1 |
| Hartmut, Grassl | 49 | 34 | 0 | 0 |
| Government of U.S. Department of State | 33 | 12 | 0 | 0 |
| Morejon, CF | 32 | 11 | 0 | 0 |
| Harvey, D | 32 | 15 | 1 | 0 |
| Read, P | 28 | 4 | 1 | 2 |
| Olivier, JGJ | 15 | 11 | 1 | 7 |
| Government of Pakistan | 14 | 9 | 0 | 0 |
| Jackson, David | 12 | 3 | 0 | 0 |
| Asamoah, Joe | 11 | 11 | 0 | 0 |
| Government of China Meteorological Administration | 11 | 5 | 0 | 0 |
| Treber, Manfred | 9 | 7 | 0 | 0 |
| Gallagher, KS | 9 | 3 | 0 | 3 |
| Government of Japan | 7 | 3 | 0 | 2 |
| Bartra, Valentin | 6 | 2 | 0 | 0 |
| Government of Finland | 6 | 5 | 0 | 0 |
| Hamilton, K | 6 | 1 | 0 | 7 |
| Llanes-Regueiro, JF | 6 | 0 | 1 | 0 |
| Nakamaru, Susumu | 6 | 0 | 0 | 0 |
| McCulloch, Archie | 6 | 6 | 0 | 0 |
| Chapman, Ralph | 4 | 3 | 0 | 0 |
| Government of Spain | 4 | 4 | 0 | 0 |
| Philibert, C | 4 | 1 | 0 | 12 |
| IPCC | 4 | 1 | 0 | 50 |
| Hernandez, Felix | 4 | 2 | 0 | 0 |
| Akimoto, K | 4 | 2 | 0 | 3 |
| Jefferson, M | 4 | 1 | 0 | 2 |
| Bogner, J | 3 | 1 | 2 | 11 |
| Government of France | 3 | 2 | 0 | 0 |
| Cook, I | 3 | 1 | 0 | 1 |
| Rilling, J | 3 | 1 | 1 | 0 |
| Goldston, Robert | 2 | 1 | 0 | 0 |
| de Gans, Gert | 2 | 0 | 0 | 0 |
| Finnegan, Pat | 2 | 1 | 0 | 0 |
| Kadono, Koji | 2 | 2 | 0 | 0 |
| Bernstein, L | 2 | 1 | 3 | 0 |
| Golub, A | 2 | 0 | 0 | 5 |
| Government of UK | 1 | 0 | 0 | 0 |
| Reisinger, Andy | 1 | 0 | 0 | 0 |
| Government of Germany | 1 | 0 | 0 | 0 |
| Levina, Ellina | 1 | 0 | 0 | 0 |
| Dave, R | 1 | 0 | 2 | 0 |
| Uddin, Noim | 1 | 0 | 0 | 0 |
| Kemfert, C | 1 | 0 | 0 | 14 |
| Bosch, P | 1 | 1 | 1 | 0 |
| Mollersten, K | 1 | 0 | 0 | 2 |
| Government of Austria | 1 | 0 | 0 | 0 |
| Gordelier, Stanley | 1 | 0 | 0 | 0 |
| Totals | 424 | 199 | 13 | 122 |
| Reviewer Type | Total Comments | Accepted | % Accepted |
|---|---|---|---|
| Govt | 74 | 37 | 50% |
| IPCC | 199 | 79 | 39% |
| Indep | 151 | 83 | 54% |
| Total | 424 | 199 | 46% |
Main AR4 Index | Working Group WG3 Index | Table of Contents | Authors | Executive Summary | Annotated Text | References | Reviewer Comments